Dabur India LtdTarget mentioned in chart - Longterm play
Leading FMCG Company Dabur India Limited is the fourth largest FMCG Company in India and the world’s largest Ayurvedic and Natural Health Care Company with a portfolio of over 250 Herbal/Ayurvedic products.
DABUR trade ideas

Dabur india share target 700this stock analysis one hour chart complete upside 5 wave impulse . and 5 wave impulse equal higher cycle wave 1 . and price correction triangle or breakout b-d trendline . use stoploss wave E .

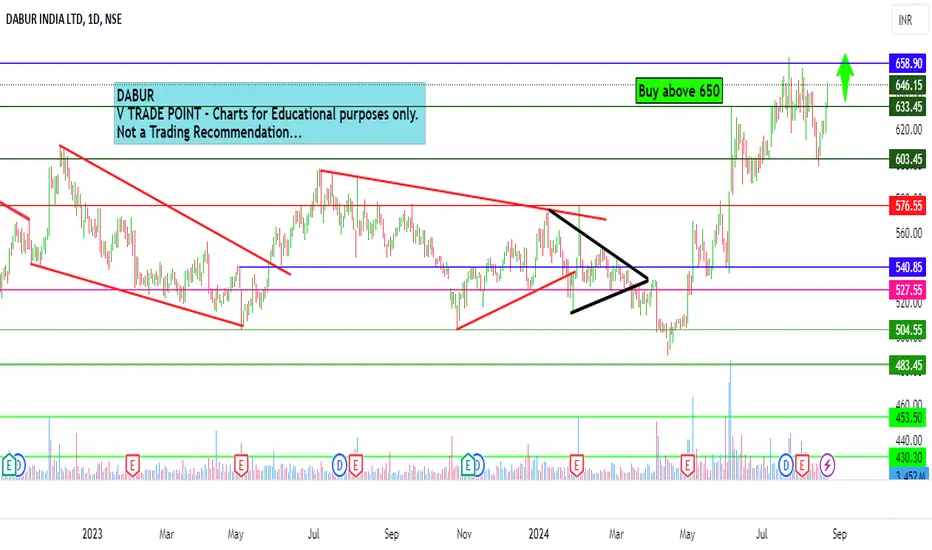
Dabur India Ltd intraday level for 23rd Aug #DABUR Dabur India Ltd intraday level for 23rd Aug #DABUR
Buying may witness above 650
Support area 644. Below ignoring buying momentum for intraday
Charts for Educational purposes only.
Please follow strict stop loss and risk reward if you follow the level.
Thanks,
V Trade Point
50 SMA Rising- Swing TradingI am not a Sebi registered adviser.
This Idea is publish purely for educational purpose only before investing in any stocks please take advise from your financial adviser.
50 SMA Rising strategy. Suitable for Swing Trading Initial Stop loss lowest of last 2 candles and keep trailing with 50 days SMA if price close below 50 SMA then Exit or be in the trade for 2 to 4 weeks.
Do not Forget to Exit if Stop loss Hit.
Be Discipline because discipline is the Key to Success in the STOCK Market.

DABUR- Will this give 20% return in next 3 Months..??Dabur (FMCG)
Stock is Consolidating from SEP 21.
SELL side & BUY side VWAP is Narrowing down.
Stock is trading near 200 DMA.
Stock has tested multiple times VWAP.
Since its Large CAP, Movement is slow and steady.
Fundamentals:
Promoters increased there stake.
Public has reduced interest.

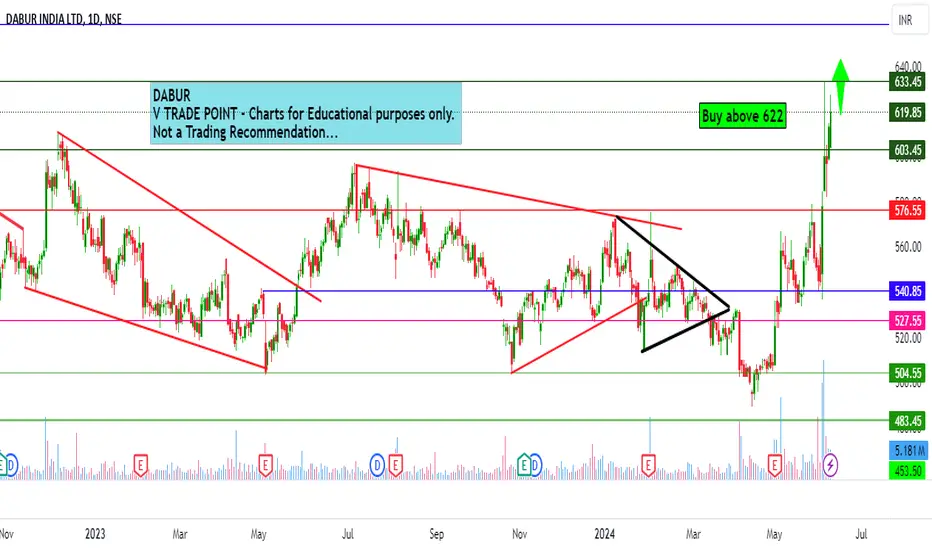
Dabur India Ltd intraday level for 5th Aug #DABUR Dabur India Ltd intraday level for 5th Aug #DABUR
Selling may witness below 623
Resistance area 630 . Above ignoring selling momentum for intraday
Charts for Educational purposes only.
Please follow strict stop loss and risk reward if you follow the level.
Thanks,
V Trade Point

DABUR INDIA LTD S/RSupport and Resistance Levels: In technical analysis, support and resistance levels are significant price levels where buying or selling interest tends to be strong. They are identified based on previous price levels where the price has shown a tendency to reverse or find support.
Support levels are represented by the green line and green shade, indicating areas where buying interest may emerge to prevent further price decline.
Resistance levels are represented by the red line and red shade, indicating areas where selling pressure may arise to prevent further price increases. Traders often consider these levels as potential buying or selling opportunities.
Breakouts: Breakouts occur when the price convincingly moves above a resistance level (red shade) or below a support level (green shade). A bullish breakout above resistance suggests the potential for further price increases, while a bearish breakout below support suggests the potential for further price declines. Traders pay attention to these breakout signals as they may indicate the start of a new trend or significant price movement.
20 EMA: The yellow line denotes 20 EMA, to interpret the 20 EMA, you need to compare it with the prevailing stock price. If the stock price is below the 20 EMA, it signals a possible downtrend. But if the stock price is above the 20 EMA, it signals a possible uptrend.
Disclosure: I am not SEBI registered. The information provided here is for learning purposes only and should not be interpreted as financial advice. It is important to consult with a qualified financial advisor before making any investment decisions. Tweets neither advice nor endorsement.

Dabur-Momentum Expected to continue-Swing Trade-Bullish NSE:DABUR
01.07.2024
Buy- 612
Target 01-633
Target 02-655
Stop-590
01.Inside bar breakout
02.Downward range ended & retracement successful
03.Previous resistance converted to support &
04. 21 EMA Rejection & price above 50 EMA
found breakout after small consolidation
05. FMCG Sector gained momentum from past few days

Dabur Long - Triangle pattern in Weekly TimeframeDabur Long - Triangle pattern in Weekly Timeframe
Price accumulation between 500 to 600 for around a 2 years.
1 wave of trending weekly and accumulation of price.
Risky buyers can enter now.
Safe buyers can enter only after 600.
Stoploss - Mentioned in the Chart.
Target - TP1 and TP2 mentioned in the Chart.

Dabur: Resistance Zone !Hey There,
- Like always, The chart is self-explanatory.
- We saw a triangle breakout which happened very close to a crucial resistance zone that acted like one.
- This is one previous support that turned crucial resistance
- Previously, the price has fallen 3 times after testing this level. The fourth time's a charm?
- We see a good consolidation at the resistance zone since the breakout
- NSE:MARICO sustained similar consolidation to fly high whereas NSE:HINDUNILVR failed to break it.
- What will DABUR do?
Have Insights or Questions? Let us know in the comments below.👇
While you do that, how about a boost for some motivation🚀
⚠️Disclaimer: We are not registered advisors. The views expressed here are merely personal opinions. Irrespective of the language used, Nothing mentioned here should be considered as advice or recommendation. Please consult with your financial advisors before making any investment decisions. Like everybody else, we too can be wrong at times ✌🏻

DABAR 650-700 move possible with stop loss of 580The Retracement shows strong tendency to Uptrend. if sustains above 600 can be a good move to 650-700.

Dabur Intraday level for today 11th June 2024Dabur Intraday level for today 11th June 2024 #DABUR
Buying opportunity above 622
Stop Loss area 616
Charts for Educational purposes only.
Please follow strict stop loss and risk reward if you follow the level.
Thanks,
V Trade Point
Dabur Intraday level for today #DABUR Dabur Intraday level for today #DABUR
Buying opportunity above 617
Stop Loss area 608
Charts for Educational purposes only.
Please follow strict stop loss and risk reward if you follow the level.
Thanks,
V Trade Point

DABUR LONGWait for a weekly candle close. As it can be seen that previously it tried to break the trendline and failed. So, wait for a weekly candle close and see if the candle BO or not. Do your own analysis before entering any trade

sell at zone ~ intradayexpecting small fall from the zone . look for confirmation inside zone in smaller tf.
- good for intraday trade
- entry inside zone
- sl is day close above zone
- for target draw fib retracement from C to latest swing high , use 0.236 fib as tgt 1 (safe place for intraday), 0.382 as tgt 2 (risk takers).
- don't trade , if u didn't get selling confirmation inside zone
- if day close is above this zone , this pattern becomes invalid.

Dabur India Ltd (NSE: DABUR) ForecastBased on the weekly chart for Dabur India Ltd (NSE: DABUR), here is the summary:
Key Levels:
- Resistance Level: Around 630-640
- Support Levels: Around 500 and 420
Current Price:
- Current Price: 555.45
Chart Analysis:
1. Failed Breakout: The chart indicates a recent breakout attempt above the resistance trendline, which has failed. The stock is now trading below this level.
2. Symmetrical Triangle: The stock appears to be forming a symmetrical triangle, indicating a period of consolidation before a potential breakout or breakdown.
3. Potential Sell Signal: Given the failed breakout and the current position below the resistance, there is a possibility of a downward move, especially if the stock breaks the support level around 502.
Targets:
- Buy Target:
- Target Price (TP) for Buy: 635
- Sell Targets:
- Short-Term Target: If the stock breaks below 502, it may head towards the support around 418.
- Long-Term Target (TP): 415
Strategy:
- Wait for Weekly Close: It is essential to wait for a weekly close to confirm the direction. A close above the resistance trendline would indicate a potential upward move, whereas a close below the support level around 502 would indicate a potential downward move.
- Buy Position: Consider buying if the stock closes above the resistance trendline with strong volume and momentum, aiming for a target of 635.
- Sell Position: Consider selling if the stock breaks below the support level around 502, with a target of 415.
Conclusion:
- The stock is currently in a critical zone with a failed breakout above the resistance trendline. Monitoring the price action around the key support and resistance levels is crucial. A clear breakout above the resistance would indicate a potential upward move towards 635, while a breakdown below the support could lead to a decline towards 415. Patience and confirmation are key before making trading decisions.

DABUR GIVES BRAKEOUT ON DAILY CHART READY TO GO HIGHNSE:DABUR
DABUR create brake out on daily chart on head and shoulder pattern with double bottom chart pattern.
its good time to create your money with Dabur.
Buy Rate 560-570
Stop Loss 540
Target 630,700+

dabur 1month time frame1. a good descending triangle pattern has been formed
2. decent support and resistance can be observe
3. just wait for the conformation
I Am Not SEBI Registered Analyst. All Post and Levels Posting is only for educational and knowledge purpose.I Am not responsible for your any kind of loss or profit.
No Claim, All Rights Reserved.‼️


buy at zoneentry:
- price should come to reversal zone
- look for confirmation in smaller TF (15min preferred )
sl :
-- if daily close is below bottom line , its sl , close positions
target
- book all positions at t3

Trading near its SupportBuy at CMP for Good Risk : Reward.... Stop 🛑 Target 🎯 Mentioned on chart
@VishwajeetSharma

DABUR INDIAcheck out Dabur India stock showing a strong support level
with an 8 to 10 % upside within a few weeks

Dabur India - Convergence and Consolidation at their peaks!Dabur India made a major swing of 273 points since Covid-19, its been 4 years that this chart has not displayed any breakout/breakdown so far. Prices are struggling in 273 points range only creating a convergence and prices are very close to explode in my own view!
Please, Share your views in this analysis too.
Thanks
