Everyday with one Equity Intraday Profitable Idea:- DALBHARAT DALBHARAT buy above 1638.
Take trade after proper buy set up.
Target 1645,1650,1660,1675,1690
SL below 1620 (1 hour closing basis).
This is not a buy/sell recommendation. It is shared for educational purpose
DALBHARAT trade ideas

Dalmia Bhart looking solid Dalmia Bharat Ltd is holding above 50 days EMA at CMP 1630 after forming a bottom for the time being between 1290 and 1341 region. X/2 Entry for a long term can be taken in Dalmia Bharat above 1645 closing. The Second X/2 entry can be taken in the counter after it closes over 1766. Targets for Dalmia Bharat will be 1875 and 2017. Stop loss should be maintained at closing below 1290. Down side of the share are its poor result in the last quarter and poor net cash flow. The positives for the company are FIIs and MFs are seen increasing their stake in the company. Dalmia Bharat is a low debt company where promoters have Zero pledge.

Dalmia Bharat looks positiveLong Idea: Above 1621, it will be crossing its 50 Moving average and may give a good run above DMA....!

DALBHARATNSE:DALBHARAT
Please note that we are not a SEBI Registered Investor Adviser/PMS/ Broking House.
All the contents over here are for educational purposes only and are not investment advice or recommendations
offered to any person(s) with respect to the purchase or sale of the stocks / futures and options.
You are also requested to apply your prudence and consult your advisers in case you choose to act on
any such content available as WE claims no responsibilities for any of your actions or any outcome of
such action
DALMIA Bharat will jump up Dalmia Bharat has given break out buy and hold for the given target ......

DALBHARAT BIG MOVEMENT CATCHSomething big going to happen ,be ready .buy as it start moving up.
good luck.

Break out opportunityDivergence & break out opportunity in this stock, potential to give good break out opportunity.

Buy DALBHARATDalmia Bharat Looks Good in Coming Days if breaks 1950-1970 range.
For Swing:
Risky Buy Above 1945 | Safe Buy above 1976 for Target of 2050, 2150 ++
SL: 1870
For Intraday:
Nice Price Action in Hourly Chart. Price retraced from 50% and about to break. If opens in range on 7/01/2021, one can go long in intraday above 1900 for target of 1920, 1940 with SL of 1880

Dalmia Bharat Limited (Long)Good volume seen
following trendline resistance
Support 1707 & 1762
Its consolidating
Resistance BO above 1885
As of now the stock has crossed 200 EMA on daily chart .
Buy near above 1885 Avg out at 1750 SL 1700 and TGT 2200
please do correlate by yourself also on charts. This is for educational and paper trading purpose only. Please consult your financial advisor before invest

DALBHARATNSE:DALBHARAT
Please note that we are not a SEBI Registered Investor Adviser/PMS/ Broking House.
All the contents over here are for educational purposes only and are not investment advice or recommendations
offered to any person(s) with respect to the purchase or sale of the stocks / futures and options.
You are also requested to apply your prudence and consult your advisers in case you choose to act on
any such content available as WE claims no responsibilities for any of your actions or any outcome of
such action


Dalmia Bharat Ltd - When to Enter?Enter only @ 2194 Levels
RSI @ 46
once it Cross above the Red Line 50 Day Moving Average.
It is Slowly gaining its Momentum but still only Advice to buy once it reach the above target as its below its 50day Moving average.

Ddalmia Bharat 1D chartSwing opportunity on Dalmia Bharath, taking support on trendline and consolidation seen from last few days

Dalmia Bharat LtdDalmia Bharat Ltd
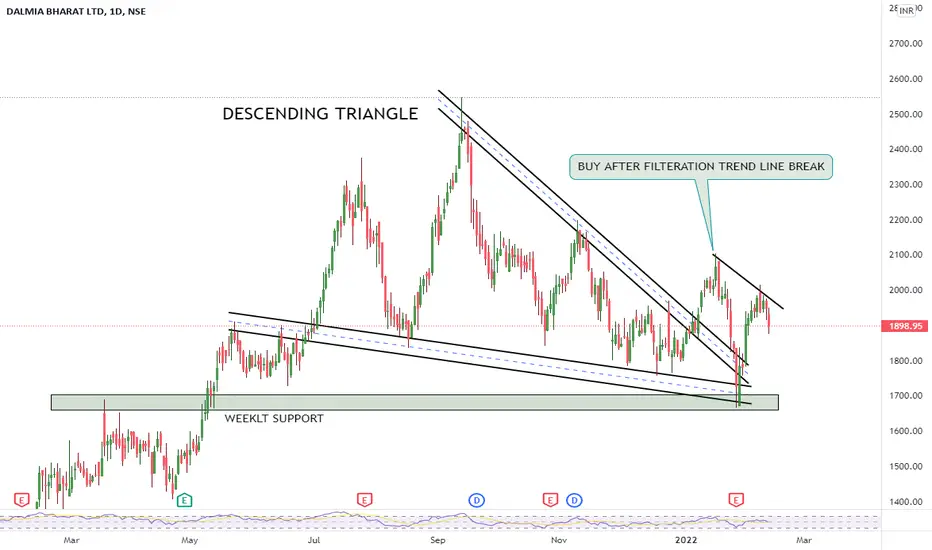
Dalmia Bharat Chart pattern
Daily Chart analysis
100 SMA Support
Small Consolidation
Think for buy with confirmation NSE:DALBHARAT

long trade dalbhart is in a channel pattern three support at the bottom two resistance at the top but its currently at the support and i think its great long opportunity.

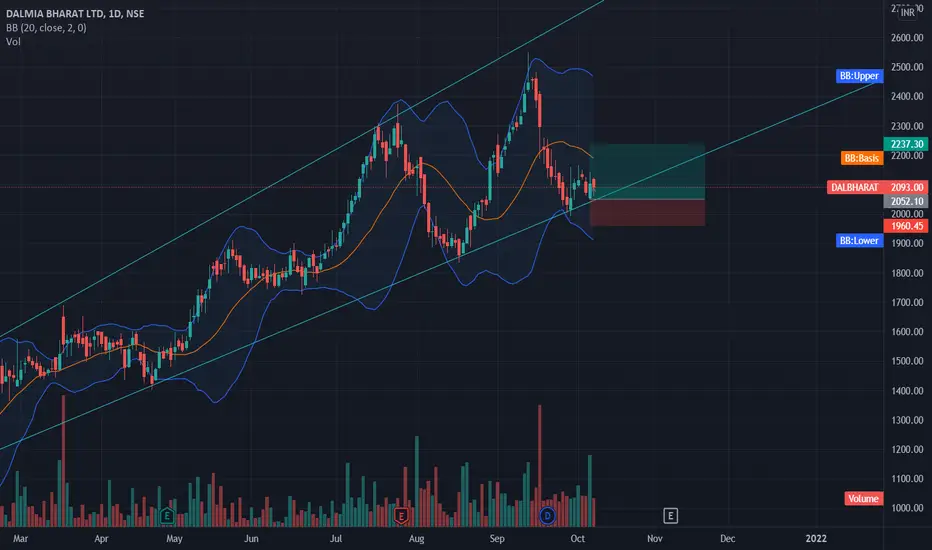
Dalmia Bharat ReversalThe stock has reached lower trendline and may undergo a reversal rally. Trade is supported by brokerage calls and Supports Nearby.
Risk Reward Ratio - 2:1
SL is placed below support zone & the lower trendline. The target is placed near swing high.
Dalmia Bharat Ltd - BuyDalmia Bharat Ltd
Good buy at CMP - 2105
Reversal towards an uptrend :)
1st Target - 2305
2nd Target - 2466
RSI - 45 towards an uptrend
Just Below its 50 Days MA - but it would cross it :)

DALMIA BHARAT - 0.786 + SUPPORT HELD WITH GOOD VOLUMEChart is self explanatory.
Safe and happy trading :)

Dalmia Bharat Short Term ReversalThe stock has reached the lower trend line and might take support and undergo a reversal rally. Trade is supported by brokerage calls and Supports Nearby.
Risk Reward Ratio - 2:1
SL is placed near below support zone & the lower trendline. The target is placed near swing high.

DALBHART Looking Bullish Above 2055DALBHART Looking Bullish Above 2055, if sustain will touch 2100, 2150, 2200 in coming days

✅ POSSIBLE REVERSAL CHART SETUP ⤴️✅ POSSIBLE REVERSAL CHART SETUP ⤴️
- High Probability Reversal Candidate.
- Price is at Crucial Support & Previous Breakout Level.
- Price is Making DOJI Candlestick at Support & Breakout Level Which is a Sign of Indecision Between Buyers & Sellers.
- Trade according to your Risk:Reward Ratio.
- Uptrend with Parallel Channel Pattern.
- Price is in Demand Zone Near Channel's Support.
- Change in Polarity Seen.
🚫This is only for Educational Purpose 🚫
➡️Consult Your Financial Advisors Before Taking Any Trade💻

Dalmia BharatEntry - 2100
Exit - 2583
SL - 1894
Trade @ ur own RISK....
Info is just for EDUCATIONAL purpose...
