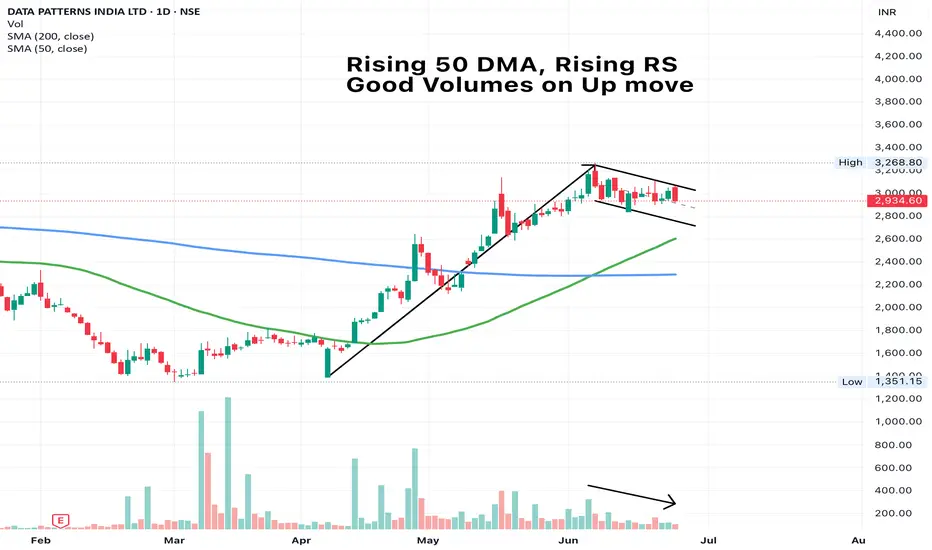
DATAPATTNS - Poised for a breakoutThoughts mentioned on charts. Simple 50 DMA rules work best always
DATAPATTNS trade ideas
DATA PATTERNS - Reversal or Just retest?The chart is self-explanatory as always.
The stock kept a downward trend eroding over 63% in value from its ATH in July,2024.
The price recently breached a crucial support at the 1750 level.
The stock is up 7% today and the price seems to be returning to this level.
The question is, Is this a reversal move to end back in the zone OR
Is it just a bounce to retest and continue its downward trajectory?
What’s your take?
Disclaimer: This analysis is purely for educational purposes and does not constitute trading advice. I am not a SEBI-registered advisor, and trading involves significant risk. Please consult with a financial advisor before making any investment decisions.

Data Patterns (India) LtdData Patterns (India) Limited is one of the fastest-growing companies in the Defence and Aerospace Electronics sector in India. It is among the few vertically integrated defence
and aerospace electronics solutions providers
catering to the indigenously developed defence products industry. It is focused on in-house development and manufacturing facilities led by innovation and design and development efforts. It is in the business for over 35 years. It has supplied products catering to all the platforms, viz., space, air, land and sea, including products for LCA-Tejas, LightUtility Helicopter, BrahMos missile.

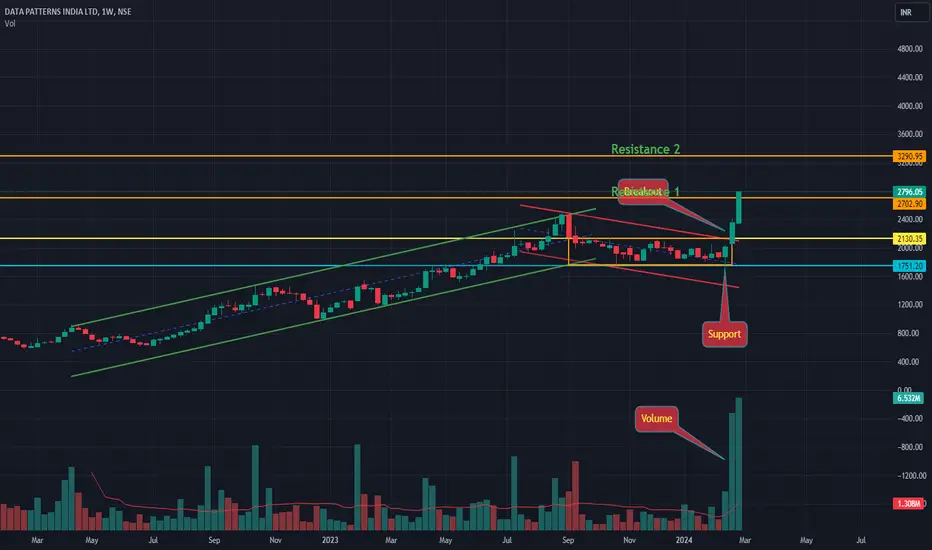
DATA PATTERNS INDIA LTD S/R Support and Resistance Levels:
Support Levels: These are price points (green line/shade) where a downward trend may be halted due to a concentration of buying interest. Imagine them as a safety net where buyers step in, preventing further decline.
Resistance Levels: Conversely, resistance levels (red line/shade) are where upward trends might stall due to increased selling interest. They act like a ceiling where sellers come in to push prices down.
Breakouts:
Bullish Breakout: When the price moves above resistance, it often indicates strong buying interest and the potential for a continued uptrend. Traders may view this as a signal to buy or hold.
Bearish Breakout: When the price falls below support, it can signal strong selling interest and the potential for a continued downtrend. Traders might see this as a cue to sell or avoid buying.
MA Ribbon (EMA 20, EMA 50, EMA 100, EMA 200) :
Above EMA: If the stock price is above the EMA, it suggests a potential uptrend or bullish momentum.
Below EMA: If the stock price is below the EMA, it indicates a potential downtrend or bearish momentum.
Trendline: A trendline is a straight line drawn on a chart to represent the general direction of a data point set.
Uptrend Line: Drawn by connecting the lows in an upward trend. Indicates that the price is moving higher over time. Acts as a support level, where prices tend to bounce upward.
Downtrend Line: Drawn by connecting the highs in a downward trend. Indicates that the price is moving lower over time. It acts as a resistance level, where prices tend to drop.
Disclaimer:
I am not a SEBI registered. The information provided here is for learning purposes only and should not be interpreted as financial advice. Consider the broader market context and consult with a qualified financial advisor before making investment decisions.

Data Patterns India Ltd view for Intraday 12th Nov #DATAPATTNSData Patterns India Ltd view for Intraday 12th Nov #DATAPATTNS
Resistance 2200-2210. Watching above 2212 for upside movement...
Support area 2150. Below 2175 ignoring upside momentum for intraday
Support 2150.Watching below 2145 for downside movement...
Resistance area 2200
Above 2175 ignoring downside move for intraday
Charts for Educational purposes only.
Please follow strict stop loss and risk reward if you follow the level.
Thanks,
V Trade Point

Technical Analysis of DATA PATTERNS INDIA LTDOverview: The chart of DATA PATTERNS INDIA LTD. showcases a robust uptrend from June 2022 to September 2024, as evidenced by the ascending support trendline. This indicates a consistent pattern of higher lows, reflecting strong buying interest and a bullish market sentiment.
Trendline Analysis: The rising trendline, drawn from the lower left to the upper right, highlights the stock’s upward trajectory. This trendline has acted as a reliable support level, with the price bouncing off it multiple times, confirming its significance. Traders often use such trendlines to identify potential entry points during pullbacks.
Fibonacci Retracement Levels: The application of Fibonacci retracement levels provides critical insights into potential support and resistance zones. After peaking around September 2023, the stock retraced to a key Fibonacci level before resuming its upward movement. This behavior is typical in trending markets, where Fibonacci levels act as psychological barriers for traders.
Volume Analysis: Volume bars on the chart indicate significant trading activity at various price levels. These volume nodes often correspond to areas where institutional investors have established positions, making them crucial zones to watch. High volume at specific price ranges suggests strong interest and can act as future support or resistance levels.
Conclusion: Given the adherence to the rising trendline and respect for Fibonacci retracement levels, the outlook for DATA PATTERNS INDIA LTD. remains optimistic. The stock’s ability to maintain its upward trajectory, coupled with significant volume at key price levels, suggests a continuation of the bullish trend. Traders should monitor these technical indicators closely and watch for any signs of weakening momentum or breaks below pivotal support levels.

Will DATAPATTNS reach 3400? cmp 2912Stock Update - *DATAPATTNS cmp 2912*
Lowered 30% from its recent high & rebounded 15% its weekly support
Broke and Holding above Daily Resistance levels
Government in focus on further strengthening national security by modernising the armed forces and boosting domestic defence manufacturing boosting the defence sector into overall bullish.
*Buy DATAPATTNS with the extended Target of 3092, 3242, 3387*
Weekly Support 2390 - 2610

Data patterns! Can again launch an arrow?Looks good for 3300
stoploss @ 3k
volume need to pick up
sideways consolidation now
need a good break with volume
Defence theme!
Fundamentals good!
Data Patterns (India) Limited is one of the fastest-growing companies in the Defence and Aerospace Electronics sector in India. It is among the few vertically integrated defence
and aerospace electronics solutions providers
catering to the indigenously developed defence products industry. It is focused on in-house development and manufacturing facilities led by innovation and design and development efforts. It is in the business for over 35 years. It has supplied products catering to all the platforms, viz., space, air, land and sea, including products for LCA-Tejas, LightUtility Helicopter, BrahMos missile.
Disclaimer: Not a buy or sell reco
follow strict stoploss and target
given for study purpose

DATA PATTERNSData patterns ready for fresh move. Elephant candle confirmation on this stock.
SL = 2000
looking gud on this price point . supported by awsome volume, and 20 MA on weekly time frame.
Risk reward ratio and probability is only the holy grail in the market.
Dont lose more than your entry reason.


Data pattern breakuing out od parttern ?chart say it all
Target upto 20%
look for 10% first
strictly base on market condition

Data Patterns (India) Limited: A Deep DiveIntroduction:
Data Patterns (India) Limited is a prominent player in the Defence and Aerospace Electronics sector in India. With a focus on in-house development and manufacturing facilities, the company has been catering to the indigenously developed defence products industry for over 35 years. In this blog, we will delve into the key aspects of Data Patterns (India) Limited, including its product portfolio, manufacturing facilities, ongoing projects, key customers, and financial performance.
Product Portfolio and Manufacturing Facilities:
Data Patterns (India) Limited offers a diverse range of products, including radars, underwater electronics/communications/other systems, electronic warfare suite, BrahMos programme, avionics, small satellites, and ATE for defence and aerospace systems. The company's manufacturing facility spans across 200,000 sq. ft and is equipped with design, manufacturing, qualification, and life cycle support of electronic systems used in defence and aerospace applications. The facility has an EMS assembly capacity of 600 boards/day and employs 1,130 employees, with 700+ qualified engineers as of March 31, 2023.
Ongoing Projects and Key Customers:
The company is currently engaged in the supply of critical products to several prestigious defence projects in India, including the Light Combat Aircraft (LCA), the HAL Dhruv, Light Utility Helicopter (LUH), and the BrahMos missile programme. Key customers include Bharat Electronics Ltd (BEL), Hindustan Aeronautics Limited (HAL), the Indian Space Research Organization (ISRO), and Defense Research and Development Organization (DRDO). DRDO contributed 42% of the total turnover.
Financial Performance:
In FY22, the company raised 588 crores through an IPO, with 240 crores being a fresh issue and the remaining 348 crores being an offer for sale. The IPO proceeds were utilized for expanding manufacturing and testing facilities in Chennai and enhancing the system integration facility. In FY23, the company raised further funds of 500 crores through QIP for the development of satellite, radar, electronic warfare, and communications products. As of March 31, 2023, 51.21 crores was unutilized from the IPO proceeds, and 462.73 crores was unutilized from the QIP proceeds.
Technical Analysis:
From a technical perspective, the regression channel pattern applied on the weekly timeframe indicates a breakout failure in September 2023, followed by another potential breakout. This could be an opportunity for long-term trend trading on an undervalued stock.
Conclusion:
Data Patterns (India) Limited is a leading defence and aerospace electronics solutions provider with a strong product portfolio, manufacturing facilities, and a diverse customer base. With ongoing projects in the defence sector and a focus on product development, the company is well-positioned for growth. The technical analysis suggests a potential breakout, which could be an opportunity for long-term investors.

Cup and Handle Pattern in DATA PATTERNS - 25% upmove expectedDATA PATTERNS has been seen in a cup and handle pattern and is on the verge of a good breakout on daily TF after almost a consolidation of almost 50 days.
Data Patterns (India) Limited is one of the fastest-growing companies in the Defense and Aerospace Electronics sector in India.
The company has increased institutional investing, almost a 50% and above increase in sales QoQ growth for the last 3 quarters and EPS growth of a minimum of 25% in the last 3 quarters
Good for swing traders. Can add to your watchlist Can hold for about 10-15 days.
Entry - INR 3020 (Kept in WL, will wait for breakout with good volume.)
SL - (Swing Low/Day low) - which ever is lowest
TSL - According to your risk profile post 20%
Disclaimer: Please be advised that the information provided is not intended as financial advice. It is imperative to conduct thorough research before making any investment or trading decisions.

DATAPATTNSStock Name - Data Patterns INDIA Ltd.
✅#DATAPATTNS trading above Resistance of 2700.
✅Next Resistance is at 3290.
✅Moved 18% in week.
Weekly chart setup
Chart is self explanatory. Levels of breakout, possible up-moves (where stock may find resistances) and support (close below which, setup will be invalidated) are clearly defined.
Master Score - B
Disclaimer: This is for demonstration and educational purpose only. this is not buying and selling recommendations. I am not SEBI registered. please consult your financial advisor before taking any trade.
One of favorite defence stock "DATA PATTERN"India has allocated a significant amount of funds to the defense sector. One stock that has gained popularity in the defense industry due to its consistent performance is now at an all-time high. I am referring to "DATA PATTERN". Are you investing in any defense stocks?

DATAPATTNSStock name = Data Patterns INDIA Limited.
Weekly chart setup
Chart is self explanatory. Levels of breakout, possible up-moves (where stock may find resistances) and support (close below which, setup will be invalidated) are clearly defined.
Master Score - B
Disclaimer: This is for demonstration and educational purpose only. this is not buying and selling recommendations. I am not SEBI registered. please consult your financial advisor before taking any trade.

Right time to Long (Datapattn)Must give space in your portfolio (10% to 20% in 20 days)
Why ?
Data Patterns (India) Ltd
ABOUT
Data Patterns (India) Limited is one of the fastest-growing companies in the Defence and Aerospace Electronics sector in India. It is among the few vertically integrated defence
and aerospace electronics solutions providers
catering to the indigenously developed defence products industry. It is focused on in-house development and manufacturing facilities led by innovation and design and development efforts. It is in the business for over 35 years. It has supplied products catering to all the platforms, viz., space, air, land and sea, including products for LCA-Tejas, LightUtility Helicopter, BrahMos missile.
KEY POINTS
Leading Defence Oriented Company
Data Patterns cater to the entire spectrum of defence and aerospace platforms like space, air, land, sea and under-sea. It has design capabilities across the entire spectrum of strategic aerospace and defence electronics solutions including processors, power, radio frequency and microwave equipment, embedded software and firmware and mechanical engineering.
Product Portfolio
Radars, Underwater electronics/communications/other systems, Electronic warfare suite, BrahMos programme, Avionics, small satellites, ATE for defence and aerospace systems, Commercial off-the-shelf (COTS). Leading product of the company is Radar with 54% contribution to the revenue.
Manufacturing Facilities
Company's manufacturing facility spans across 200,000 sq. ft factory built on 8.56 acres of land in Chennai. It has facilities for design, manufacturing, qualification, and life cycle support of electronic systems used in defence and aerospace applications. The facility has EMS assembly capacity of 600 boards/day.
The company has 1,130 employees with 700+ qualified engineers as on 31.3.23. They commissioned a New Manufacturing facility in Q4FY23.
On-Going Projects
The company is currently engaged in the supply of critical products to several prestigious defence projects in India, including the Light Combat Aircraft (LCA), the HAL Dhruv, Light Utility Helicopter (LUH) and the BrahMos missile programme, precision approach radars and various communications intelligence (COMINT) and electronic intelligence (ELINT) systems.
Key Customers
Bharat Electronics Ltd (BEL), Hindustan Aeronautics Limited (HAL), the Indian Space Research Organization (ISRO) and Defense Research and Development Organization (DRDO).
DRDO contributed 42% of the total turnover.
Dependent on GOI Entities
The company’s business is dependent on projects and programmes undertaken by GOI and associated entities such as defence public sector undertakings and government organisations involved in space research and Supply of products to prestigious defence projects in India Like LCA, the HAL Dhruv, LUH and the BrahMos missile programme. Data Patterns derives a significant portion (~45-50%) of its total sales from contracts with GOI entities.
Order Book
As of FY23, company's order book stood at Rs. 924.1 Cr. vs Rs. 476 Cr in FY22.In FY23, company had the highest-ever order inflow of Rs. 901 crores. The company got additional orders from April- May 2023 worth Rs 83.9 cr.
**Liquidity **
Company has Cash and cash equivalents
Rs.682.5 Cr as of 31.3.23.
IPO Details
In FY22, company raised 588 cr. through an IPO of which Rs. 240 cr. was a fresh issue and the remaining 348 cr. was an offer for sale. The IPO proceeds were utilized for:
1. Expanding manufacturing and testing facilities in Chennai and enhancing system integration facility.
Out of the total fund raised, 51.21 crores was unutilized as on March 31, 2023.
Investment through QIP in FY23
Company is making large investments in product development in Satellite, Radar, Electronic Warfare and Communications. It has raised further funds of Rs 500 Cr. through QIP for development of these products. Initially, these products will be introduced in the domestic market.The Company has issued and allotted 4,097,319 equity shares through QIP at an issue price of Rs.1,220.31/- on March 13, 2023. Out of the proceeds, Rs.462.73 crs is unutilized as on March 31, 2023.
Change in Statutory Auditors
Deloitte Haskins & Sells LLP were appointed as the statutory auditors in place of M/s. R.G.N. Price & Co. Fees for FY24 was decided at Rs47 lakhs exclusive of taxes and other expenses.
CAPEX FY23
Company added Rs. 74.47 Crores to their gross block with capital expenditure, including Right to the Assets (ROU) of Rs.47.22 Crores on building & lease, Rs.10.77 Crores on technology infra, Rs.16.48 Crores on physical infra and the balance Rs.1.03 Crores on intangible asset addition.
If you make profit, don't forget me (+919955150786)
Gift a pitza😎

Data Patterns trying to breakout and form a positive pattern. Data Patterns (India) Ltd. is among the few vertically integrated defense and aerospace electronics solutions providers catering to the indigenously developed defense product industry. It is one of the fastest-growing companies in the Defense and Aerospace Electronics sector in India. Data Patterns (India) Ltd CMP is 1978.55.
The Negative aspects of the company are High Valuation (P.E. = 74.7). Declining cash from operations and MFs decreasing stake. The positive aspects of the company are No debt, zero promoter pledge, FIIs are increasing stake, and improving annual net profit.
Entry can be taken after closing above 1996. Targets in the stock will be 2045 and 2115. The long-term target in the stock will be 2181 and 2253. Stop loss in the stock should be maintained at Closing below 1840.
The above information is provided for educational purpose, analysis and paper trading only. Please don't treat this as a buy or sell recommendation for the stock. We do not guarantee any success in highly volatile market or otherwise. Stock market investment is subject to market risks which include global and regional risks. We will not be responsible for any Profit or loss that may occur due to any financial decision taken based on any data provided in this message.

Comprehensive Analysis of DATAPATTNS (NSE: DATAPATTNS)Technical Overview:
1. Support and Trend Analysis:
The weekly chart for DATAPATTNS indicates a strong technical setup. The recent candle has found Support at the Rising Trendline, reinforcing the presence of a robust support level. This suggests a potential continuation of the prevailing uptrend.
2. RSI Support and Bullish Momentum:
The support observed on the Relative Strength Index (RSI) aligns with the price action, indicating a synchronicity between momentum and price. A bullish momentum is suggested, reflecting positive investor sentiment.
Trade Execution Strategy:
1. Entry:
Consider initiating a long position at the current market price (CMP) of 1904. This entry point is selected based on the support at the Rising Trendline and the indication of bullish momentum from the RSI.
2. Stop Loss Placement:
Set a stop loss at 1820 to mitigate potential downside risks. This level is strategically chosen to allow for minor price fluctuations while acting as a protective barrier against significant adverse movements.
3. Target Setting:
Set a target at 2020, reflecting the potential upside as suggested by the support at the Rising Trendline. This level is aligned with the technical dynamics observed in the chart.
Risk Factors and Considerations:
1. Market Dynamics:
Acknowledge that broader market conditions and unforeseen events can impact individual stock movements. Stay informed about market trends and events that may influence DATAPATTNS.
2. Risk-Reward Evaluation:
Evaluate the risk-reward ratio of the trade. Confirm that the potential reward justifies the assumed risk, adhering to the principle of maintaining a favorable risk-reward profile.
3. Continuous Monitoring:
Regularly monitor the trade for any changes in the technical setup or unexpected market developments. Be prepared to adjust the strategy based on evolving conditions.
Conclusion:
The technical analysis suggests a favorable opportunity in DATAPATTNS, marked by strong support at the Rising Trendline and indications of bullish momentum. While the setup appears promising, it's important to approach the trade with a comprehensive risk management strategy and stay vigilant for any changes in the technical landscape. Trading involves uncertainties, and a disciplined approach is essential for navigating potential risks effectively.

Data PatternData Pattern looking good for swing after successful breakout. Keep an eye on it. View is just for educational purpose. It is making a new higher low and is not breaking its previous swing.

DATAPATTNS - Stock AnalysisSymbol: DATAPATTNS
Close: 1979.65
Today's Volume: 651391
Sector: Aerospace & Defense
Go Long above: 1990
Stop Loss below: 1708.1
Resistance & Support:
📉 R: 2028 || 2076 || 2163
📈 S: 1893 || 1807 || 1759

Data patternsData Patterns Chart Analysis 26/11/23
Long : 1910
Sl : 1800
Target : 2030 / 2130 / 2265
Enjoy !

A Strong Reversal Breakout StockDATAPATTNS looks like it's about to turn around:
1. Moving Average Move:
- The stock is breaking through the 50-day average, suggesting a shift in its recent trend.
2. Big Volume Boost:
- Lots of people are trading it, showing a lot of interest and confidence in a possible change in direction.
3. Bouncing Back:
The stock is bouncing off a price level where it has stayed strong before.
3. Risk and Reward:
Candlestick Clue:
Keep an eye out for a special candle shape indicating a big market sentiment change. If the lowest point of that candle holds, it's a good sign.
For those starting out in stocks, DATAPATTNS seems like an interesting possibility.
Anything you need to ask? Here is me : 8800611235.
#stocks #trading #investing
