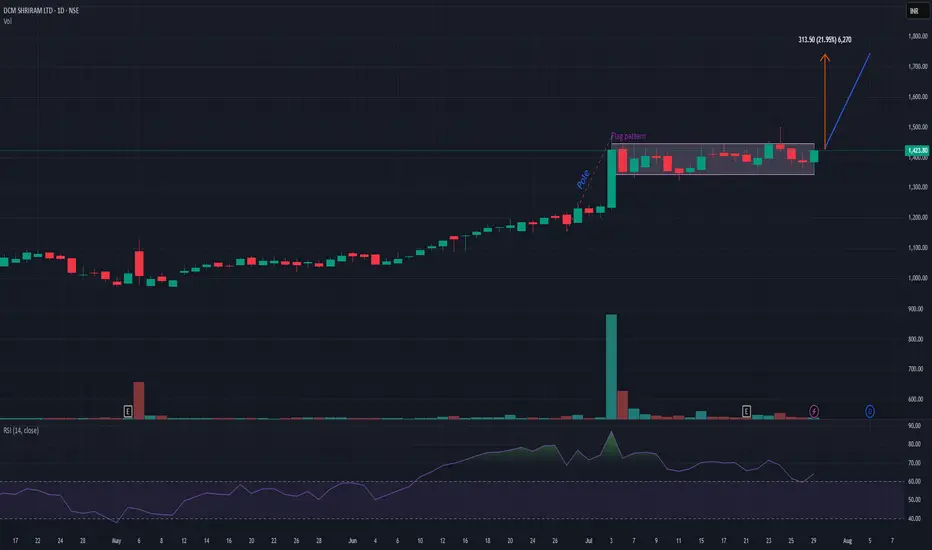
DCMSHRIRAMDCMSHRIRAM is on verge of flag pattern breakout provided that it closes above 1440 level. It has a potential to add up to 20-22% from this level. My view may change if it closes below 1350. Risk-reward is quite in favor. Keep it on radar.
DCMSHRIRAM trade ideas
Amazing breakout on WEEKLY Timeframe - DCMSHRIRAMCheckout an amazing breakout happened in the stock in Weekly timeframe, macroscopically seen in Daily timeframe. Having a great favor that the stock might be bullish expecting a staggering returns of minimum 25% TGT. IMPORTANT BREAKOUT LEVELS ARE ALWAYS RESPECTED!
NOTE for learners: Place the breakout levels as per the chart shared and track it yourself to get amazed!!
#No complicated chart patterns
#No big big indicators
#No Excel sheet or number magics
TRADE IDEA: WAIT FOR THE STOCK TO BREAKOUT IN WEEKLY TIMEFRAME ABOVE THIS LEVEL.
Checkout an amazing breakout happened in the stock in Weekly timeframe.
Breakouts happening in longer timeframe is way more powerful than the breakouts seen in Daily timeframe. You can blindly invest once the weekly candle closes above the breakout line and stay invested forever. Also these stocks breakouts are lifelong predictions, it means technically these breakouts happen giving more returns in the longer runs. Hence, even when the scrip makes a loss of 10% / 20% / 30% / 50%, the stock will regain and turn around. Once they again enter the same breakout level, they will flyyyyyyyyyyyy like a ROCKET if held in the portfolio in the longer run.
Time makes money, GREEDY & EGO will not make money.
Also, magically these breakouts tend to prove that the companies turn around and fundamentally becoming strong. Also the magic happens when more diversification is done in various sectors under various scripts with equal money invested in each N500 scripts.
The real deal is when to purchase and where to purchase the stock. That is where Breakout study comes into play.
Check this stock which has made an all time low and high chances that it makes a "V" shaped recovery.
> Taking support at last years support or breakout level
> High chances that it reverses from this point.
> Volume dried up badly in last few months / days.
> Very high suspicion based analysis and not based on chart patterns / candle patterns deeply.
> VALUABLE STOCK AVAILABLE AT A DISCOUNTED PRICE
> OPPURTUNITY TO ACCUMULATE ADEQUATE QUANTITY
> MARKET AFTER A CORRECTION / PANIC FALL TO MAKE GOOD INVESTMENT
DISCLAIMER : This is just for educational purpose. This type of analysis is equivalent to catching a falling knife. If you are a warrior, you throw all the knives back else you will be sorrow if it hits SL. Make sure to do your analysis well. This type of analysis only suits high risks investor and whose is willing to throw all the knives above irrespective of any sectoral rotation. BE VERY CAUTIOUS AS IT IS EXTREME BOTTOM FISHING.
HOWEVER, THIS IS HOW MULTIBAGGERS ARE CAUGHT !
STOCK IS AT RIGHT PE / RIGHT EVALUATION / MORE ROAD TO GROW / CORRECTED IV / EXCELLENT BOOKS / USING MARKET CRASH AS AN OPPURTUNITY / EPS AT SKY.
LET'S PUMP IN SOME MONEY AND REVOLUTIONIZE THE NATION'S ECONOMY!
DCM shriramAfter 4 years cobsolidation with huge volume breakout
This is only for study purpose not any buy or sell.
DCM Shriram Ltd view for Intraday 8th May #DCMSHRIRAM DCM Shriram Ltd view for Intraday 8th May #DCMSHRIRAM
Resistance 1020-1025 Watching above 1027 for upside movement...
Support area 1000 Below 1010 ignoring upside momentum for intraday
Watching below 995 for downside movement...
Above 1010 ignoring downside move for intraday
Charts for Educational purposes only.
Please follow strict stop loss and risk reward if you follow the level.
Thanks,
V Trade Point

DCM Shriram Ltd view for Intraday 6th May #DCMSHRIRAM DCM Shriram Ltd view for Intraday 6th May #DCMSHRIRAM
Resistance 1020-1025 Watching above 1027 for upside movement...
Support area 1000 Below 1010 ignoring upside momentum for intraday
Watching below 998 for downside movement...
Above 1010 ignoring downside move for intraday
Charts for Educational purposes only.
Please follow strict stop loss and risk reward if you follow the level.
Thanks,
V Trade Point

DCM shriram : watchlist candidate Breakout required for confirmation
.
DCM Shriram is engaged in the business of manufacturing facilities of Fertiliser, Chloro Vinyl & Cement in Kota (Rajasthan) and of Chlor- Alkali in Bharuch (Gujrat).

Necklace Pattern- DCMShriramIs this getting ready for some move?
DCM Shriram
Can this rally, take it up?
DCM Shriram is all set, isnt it?

momentum comingfib Tracing breakout level . it will give expected targets with in 1 month
Holding Period 1 month
Entry level 1186
wait for entry level

DCMSHRIRAM | If closing above 1130Disclaimer:
This is not financial advice. Please do your own research or consult with a financial advisor before making any investment decisions. Investments in stocks can be risky and may result in loss of capital.

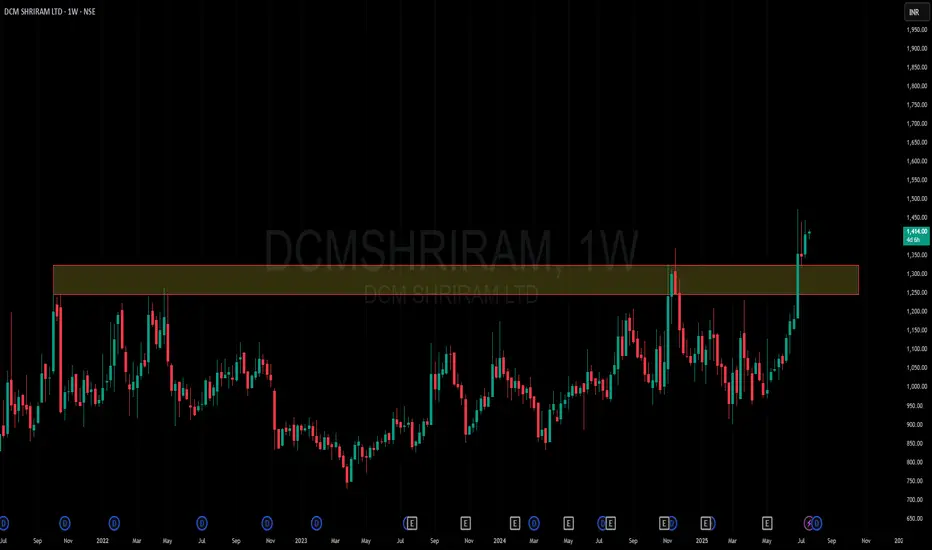
Multiyear Breakout Re-TestAfter Multiyear Consolidations breakout price finally retest its breakout level and as per price action previous resistance now act as a support .

DCMSHRIRAM CMP 1300DCM SHRIRAM LTD on weekly timeframe breaking weekly upper bollinger band with high volume thats the sign for a long bullish trend .From three years it was consolidating in this zone now this level breaked add this to your wachlist and find best entry area Risk and Reward is yours. Thanks.

Darvas Box Strategy - Break out Stock - Swing TradeDisclaimer: I am Not SEBI Registered adviser, please take advise from your financial adviser before investing in any stocks. Idea here shared is for education purpose only.
Stock has given break out. Buy above high. Keep this stock in watch list.
Buy above the High and do not forget to keep stop loss, best suitable for swing trading.
Target and Stop loss Shown on Chart. Risk to Reward Ratio/ Target Ratio 1:1 & 2
Stop loss can be Trail when it make new box / Swing.
Be Discipline, because discipline is the key to Success in Stock Market.
Trade what you See Not what you Think.

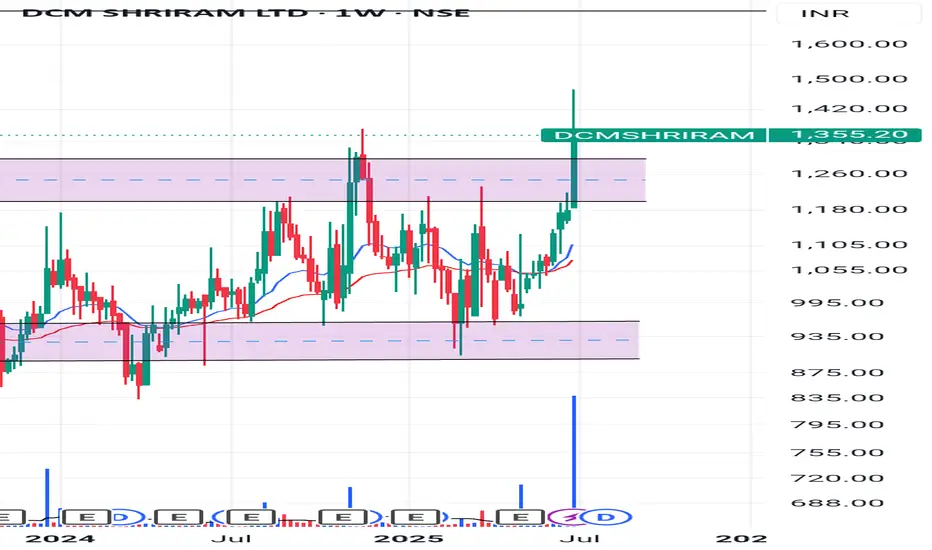
Positional Trade Idea for #DCM ShriramDCM Shriram has formed a textbook cup-and-handle pattern on the weekly chart, breaking out above the resistance zone around ₹1,240. With strong volume support, this breakout indicates potential upside momentum.
💥 Entry: Around ₹1,240
💥 Target: ₹1,400+
💥 Stop-Loss: ₹1,150
#StockMarket #Trading #PositionalTrade #Breakout

DCM SHRIRAM above trendline breakoutDCM SHRIRAM looks good above trendline breakout...
Disclaimer:
This analysis is for informational purposes only and does not constitute investment advice. Trading involves significant risk and may result in the loss of capital. Always conduct your own research or consult a financial advisor before making investment decisions. I am not responsible for any actions taken based on this analysis.

DCM SHRIRAM LTD S/R Support and Resistance Levels: In technical analysis, support and resistance levels are significant price levels where buying or selling interest tends to be strong. They are identified based on previous price levels where the price has shown a tendency to reverse or find support.
Support levels are represented by the green line and green shade, indicating areas where buying interest may emerge to prevent further price decline.
Resistance levels are represented by the red line and red shade, indicating areas where selling pressure may arise to prevent further price increases. Traders often consider these levels as potential buying or selling opportunities.
Breakouts: Breakouts occur when the price convincingly moves above a resistance level (red shade) or below a support level (green shade). A bullish breakout above resistance suggests the potential for further price increases, while a bearish breakout below support suggests the potential for further price declines. Traders pay attention to these breakout signals as they may indicate the start of a new trend or significant price movement.
20 EMA: The yellow line denotes 20 EMA, to interpret the 20 EMA, you need to compare it with the prevailing stock price. If the stock price is below the 20 EMA, it signals a possible downtrend. But if the stock price is above the 20 EMA, it signals a possible uptrend.
Disclosure: I am not SEBI registered. The information provided here is for learning purposes only and should not be interpreted as financial advice. It is important to consult with a qualified financial advisor before making any investment decisions. Tweets neither advice nor endorsement.

DCM Shriram can make a recovery and give a Breakout. DCM Shriram Ltd. is a diversified company with business in agri, chemicals, plastics, cement, textiles and energy services. They are having two broad operational thrusts namely, the energy intensive businesses that include chloro-vinyl chain and cement and the agri-businesses that cover urea, sugar, hybrid seeds and agri-merchandised inputs. The business portfolio of the Company comprises of Chloro-Vinyl, sugar, Shriram Farm Solutions, bio seed, fertilizers, etc.
DCM Shriram Ltd. CMP is 954.4. The Negative aspects of the company are Moderately high valuation (P.E. = 28.7), declining annual net profit, MFs are decreasing stake. The company's Positive aspects are No debt, increasing cash from operations annual, Zero promoter pledge, FIIs are increasing stake,
Entry can be taken after closing above 955. Final Entry closing above 990. Targets in the stock will be 1029, 1055 and 1079. The long-term target in the stock will be 1109, 1145 and 1178. Stop loss in the stock can be 900 or 870 depending upon your risk taking ability.
The above information is provided for educational purpose, analysis and paper trading only. Please don't treat this as a buy or sell recommendation for the stock. We do not guarantee any success in highly volatile market or otherwise. Stock market investment is subject to market risks which include global and regional risks. We will not be responsible for any Profit or loss that may occur due to any financial decision taken based on any data provided in this message.

Just A View - Double Top - DCMSHRIRAM📊 Script: DCMSHRIRAM
📊 Sector: Diversified
📊 Industry: Diversified - Mega
Key highlights: 💡⚡
📈 Script is trading near neck line that is support of Double Top pattern as seen into the chart .
📈 Script may take support at 862 level and bounce back from there.
📈 One can go for swing trade for medium to long term.
⏱️ C.M.P 📑💰- 872
⚠️ Important: Always maintain your Risk & Reward Ratio.
✅Like and follow to never miss a new idea!✅
Disclaimer: I am not SEBI Registered Advisor. My posts are purely for training and educational purposes.
Eat🍜 Sleep😴 TradingView📈 Repeat 🔁
Happy learning with trading. Cheers!🥂

DCM Shriram Long PositionalBuy DCM Shriram @ CMP
for the Target of 1163-1278-1392-1509
SL 904
Strategy : RSI > 60 + EMA above 20 & 50
Duration few Weeks

DCM Shriram slowly forming a cup and handle pattern. DCM Shriram Ltd. is a diversified company with business in Agri, chemicals, plastics, cement, textiles and energy services. DCM Shriram Ltd CMP is 960.15.
The Negative aspects of the company are Declining annual net profit, MFs are decreasing stake. The positive aspects of the company are No debt, zero promoter pledge, FIIs are increasing stake, Improving cash from operations annual.
Entry can be taken after closing above 969. Targets in the stock will be 1001 and 1045. The long-term target in the stock will be 1094 and 1119. Stop loss in the stock should be maintained at Closing below 923.
The above information is provided for educational purpose, analysis and paper trading only. Please don't treat this as a buy or sell recommendation for the stock. We do not guarantee any success in highly volatile market or otherwise. Stock market investment is subject to market risks which include global and regional risks. We will not be responsible for any Profit or loss that may occur due to any financial decision taken based on any data provided in this message.

Weekend idea 2: DCM Shriram can rise, investing can be idea wiseDCM Shriram Ltd. is a diversified company with business in agriculture, chemicals, plastics, cement, textiles and energy services. DCM Shriram CMP is 938.55.
The Negative aspects of the company are MFs are decreasing stake. The positive aspects of the company are No debt, zero promoter pledge, FIIs increasing stake, improving annual net profit, and Improving cash from operations annually.
Entry can be taken after closing above 969. Targets in the stock will be 1016 and 1066. The long-term target in the stock will be 1119. Stop loss in the stock should be maintained at Closing below 853.
The above information is provided for educational purpose, analysis and paper trading only. Please don't treat this as a buy or sell recommendation for the stock. We do not guarantee any success in highly volatile market or otherwise. Stock market investment is subject to market risks which include global and regional risks. We will not be responsible for any Profit or loss that may occur due to any financial decision taken based on any data provided in this message.

Strength Gaining Stock! #DCMSHRIRAMStrength Gaining Stock!
DCM Shriram Ltd #DCMSHRIRAM
1- Breaking out Resistance
2- High Weekly Volume
3- Outside Bar
Note: Technical Analysis is for Educational Purpose. I am not SEBI registered. Consult your financial advisor for any Investment Advice.

DCMSHRIRAM Breaks Key Resistance Level with High Volume
🔍 Overview 🔍
DCMSHRIRAM, has been facing strong resistance at the 910-920 level since November 2022. Interestingly, the 910 level has been acting as both support and resistance since June 2021. Today, we witnessed a breakthrough of the 910-920 level with a significant surge in volume. This breakout occurred on the weekly and daily charts, making it a crucial development to consider.
📊 Technical Analysis 📈
Plan buy trade near closing of market if breakout sustains above resistance
DCMSHRIRAM has been consolidating within the 910-920 range for several months, indicating a period of indecision and lack of clear direction in the stock's price movement.
The 910 level has proved to be a significant support and resistance zone in the past, highlighting its importance in determining the stock's future trajectory.
Today, we observed a breakout above the 910-920 range with an extraordinary surge in volume, suggesting strong buying interest and a potential shift in market sentiment.
The breakout on both the weekly and daily charts strengthens the bullish case for DCMSHRIRAM, as it indicates a potential trend reversal and the beginning of a new upward movement.
📊 Technical Terms 📈
Before delving further into the analysis, let's clarify some technical terms for those new to trading:
1. Resistance Level: A price level at which selling pressure is historically strong, causing the stock's price to struggle to rise above it.
2. Support Level: A price level at which buying interest is historically strong, preventing the stock's price from falling below it.
3. Breakout: The movement of a stock's price above a significant resistance level or below a significant support level, indicating a potential change in the stock's trend.
4. Volume: The number of shares or contracts traded in a security or market during a given period. High volume often indicates increased market activity and can confirm the strength of a price move.
👍📝 Like, Comment, and Follow 👍📝
If you found this analysis helpful, don't forget to give it a thumbs up! Feel free to share your observations in the comments section below. Your feedback and engagement are highly appreciated as they keep me motivated to consistently provide educational content.
Thank you for your support, likes, follows, and comments. It means a lot to me! If you want to stay updated with more articles and trade setups, make sure to follow me on TradingView: in.tradingview.com
💪🚀 Trading is not just about making money; it's a journey of self-discovery and personal growth. Embrace the challenges and keep pushing forward! 💪🚀
Remember, this analysis is for educational purposes only, and I am not a SEBI registered analyst. Always conduct thorough research and consult with a certified professional before making any investment decisions. Happy trading!

#DCMSHRIRAM-Double bottom formation. Swing trade for 10% up movestock was in down trade for quite a while but recently made double bottom and on the way of getting breakout above W pattern neckline.
