Deepak Fertilisers- mera Ghar kaa DEEP!!📊 Summary:
Deepak Fertilizers has successfully broken out of a Cup and Handle pattern with a weekly close above ₹1450, confirming a strong bullish trend. RSI supports the move, and price action aligns with classic breakout behavior.
🔍 Technical Breakdown:
Pattern: Cup & Handle formation – bullish continuation setup.
Breakout Zone: ₹1450 breached on weekly closing basis.
Stoploss: Revised to ₹1414 (recent swing low and pattern base).
Immediate Resistance: ₹1637 (recent high – minor resistance).
Next Target Zone: ₹1750–₹1850 (based on cup depth projection and pattern breakout).
RSI (14): 69.17 – just below overbought zone, strong momentum.
Volume: 1.24M – confirms breakout strength with good participation.
✅ Suggestions:
Trend Confirmation: Weekly close above ₹1450 = Confirmed uptrend.
Buy on Dips: Any retest toward ₹1450–₹1475 could be a good entry zone.
Short-Term Targets: ₹1650–₹1700
Medium-Term Targets: ₹1800–₹2000 (Cup & Handle measured move)
Stoploss (Trailing): ₹1414 (weekly close basis) – can be revised higher as price progresses.
RSI Alert: Watch if RSI crosses into 70–75 zone – that may signal potential overbought conditions; partial profit booking advised.
⚠️ Caution:
After a sharp breakout, minor pullbacks are natural – don’t panic on short-term dips.
Avoid chasing the price – wait for consolidation or minor retracement to enter.
📌 Conclusion:
Deepak Fertilizers has entered a strong bullish phase post a confirmed Cup and Handle breakout. Momentum is healthy, supported by volume and RSI. Maintain a bullish stance with a trailing stop below ₹1414, and ride the trend toward ₹1750+ over the coming months.
DEEPAKFERT trade ideas

DEEPAK FERTILIZER - Breaking Out in DTF, New ATHDEEPAKFERT has resistance weakening on the Daily charts and has given a breakout with good volume and making a new ATH.
The target of this pattern signals an upside potential of 20% from the current price level in the medium term.
The stock is trading above its 50- and 100-day exponential moving averages (EMAS). The range is more than 1.5X, and the Volume is also 1.5X the average.
CMP- Rs. 1449.80
Target Price- Rs. 1650 (~20% upside)
SL- 1356
Disclaimer: This is not a buy/sell
recommendation. For educational purpose only. Kindly consult your financial advisor before entering a trade.

Ye chart kuch kehta hai : Deepak FertilizerClear break-out on cup, retested level of 1018 and started onwards journey for next high. Stock continue to make higher high for last 3 weeks. ROCE is not strong, but CAPEX investment fruits are expected to be rolling over. Though one may not like fundamental but technical indicators are favorable.

Our Df came into mark up phase...deepak FERTILISERS gave decisive break out of BULLISH flag with GOOD volume and Healthy momentum while still being in value zone on 15 of April. very soon it will kiss the level of 3000 or even more (100 % expension level of ROUNDING BOTTOM). However Price will have to sail through the waves of Beers at the zone of 1740-1930.

DEEPAK FERTLZR -LONGNSE:DEEPAKFERT Weekly parabolic formation with macd crossover and buyers. May continue further trend upside.

Deepak Fert. Shatters Resistance Post-Earnings: Time to Buy..?Deepak Fertilisers & Petrochemicals Corporation Limited has announced robust financial results for the third quarter of the fiscal year 2025, revealing a remarkable net profit of ₹251 crore. This figure represents an impressive surge of 335.6% compared to the net profit of ₹57.6 crore recorded during the same quarter last year, highlighting the company's strong operational performance and growth trajectory.
On the technical front, the stock has notably breached a significant resistance level at ₹1228, indicating a bullish trend. Investors may consider taking advantage of a potential pullback to enter the stock, making it an appealing opportunity for both swing traders looking to capitalize on short-term movements and long-term investors aiming for sustained growth. Overall, this performance underscores Deepak Fertilisers' position in the market and could signal further upside potential in the coming quarters.

Deepak fertiliser Positional studyPrior uptrend
No overhead supply left side
Shake out weak hands
Increased RS
High volume on up days in base
High volume Breakout

DEEPAKFERT -LOOKING BULLISHDEEPAKFERT -LOOKING BULLISH - With Year on Year & QoQ increased Earnings with DOUBLE BOTTOM & SPRING pattern developing on charts - looking for a bullish trades.
Darvas Box Strategy - Break out Stock - Swing TradeDisclaimer: I am Not SEBI Registered adviser, please take advise from your financial adviser before investing in any stocks. Idea here shared is for education purpose only.
Stock has given break out. Buy above high. Keep this stock in watch list.
Buy above the High and do not forget to keep stop loss, best suitable for swing trading.
Target and Stop loss Shown on Chart. Risk to Reward Ratio/ Target Ratio 1:1
Stop loss can be Trail when it make new box / Swing.
Be Discipline, because discipline is the key to Success in Stock Market.
Trade what you See Not what you Think.


Deepak Fertlisers Ltd view for Intraday 4th Dec #DEEPAKFERT Deepak Fertlisers Ltd view for Intraday 4th Dec #DEEPAKFERT
Resistance 1370. Watching above 1375 for upside movement...
Support area 1335-1340 Below 1355 ignoring upside momentum for intraday
Support 1335-1340 Watching below 1335 for downside movement...
Resistance area 1355
Above 895 ignoring downside move for intraday
Charts for Educational purposes only.
Please follow strict stop loss and risk reward if you follow the level.
Thanks,
V Trade Point

DEEPAK FERTbook profit as negative div in 5 min chart and trendline resistance. We are at 5th wave and target of deepak achieved today

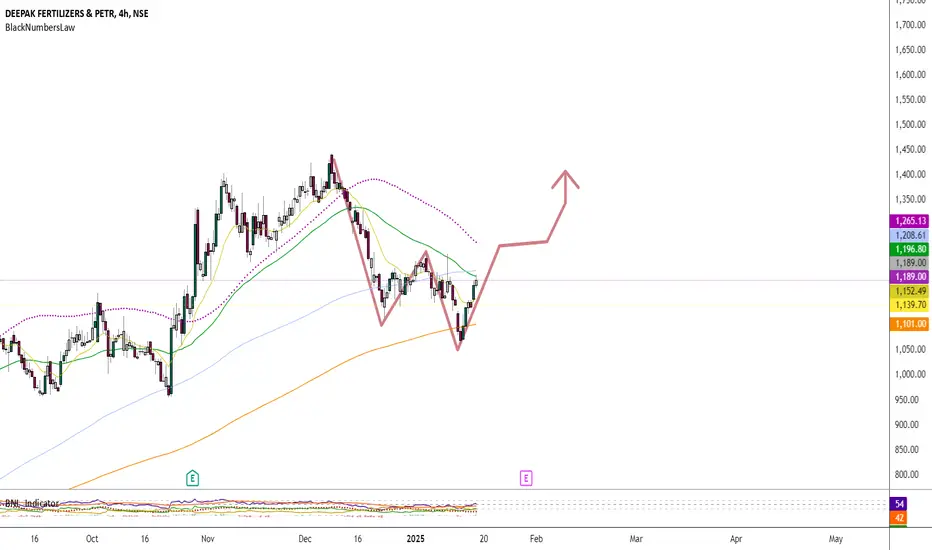
Deepak Fertilizers - Breakout Setup (Swing Trade)Deepak Fertilizers has reached a critical zone, and a breakout appears to be forming. Here’s the trade plan:
Entry Zone: 1134
Entry Price: Once a 15-minute candle breaks above 1134 , the high of that 15-minute candle will confirm the entry.
Target: 1492.8
Stop Loss: 954.60 (Valid only if a daily candle closes below this level)
This setup offers a favorable risk-to-reward ratio. The price is testing the entry zone, and a breakout above it could lead to a potential rally towards 1492.8 . The stop loss is well-defined at 954.60 , which is only triggered if a daily candle closes below it.
Disclaimer: This post is for educational purposes only and not financial advice. Always manage your risk and trade responsibly.

PRICE AT SUPPLY ZONEGood volume buildup in daily and weekly timeframe.
2 month consolidation possible breakout with good volume buildup till now.
Price has taken support third time from demand zone.
Date range matched.
Fundamentals are OK.
DII stakes are up.
Observation: Compare nifty last 3 candle with stock last three candle.
NOTE: I do my analysis, do yours before trade.
Eat🍜 Sleep😴 TradingView📈 Repeat 🔁

Deepak Fert : Channel Breakout in progressDeepakFert :
Channel Breakout and currently at resistance
Looks good above 1140, breaking 1160 will take this to newer highs

SWING IDEA - DEEPAKFERTPrice Action is making Lower Low Pattern, while MACD Cross is making Higher Low Pattern.
MACD is showing good momentum upward.
The stock should be ready for its next leg up, at least until the next Support/Resistance zone.
Worst case, a retest to the nearest Support zone @ 480 levels.
Any weekly closing under this level can take the stock to new lows.
Trade with the Trend.

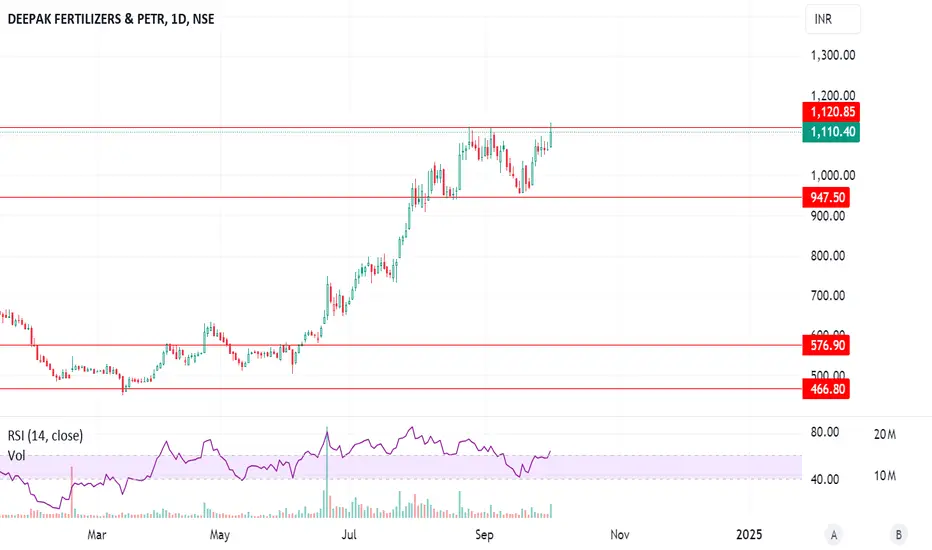
Positional setup in Deepak Fertilizers & Petrochemicals Based on the chart of Deepak Fertilizers & Petrochemicals, it appears that the stock is currently at a resistance level of ₹1,111.90, while previously testing support around ₹955.50. The stock is up 4.09% for the day, with a bullish momentum as indicated by the price action and a Relative Strength Index (RSI) at 63.40, suggesting room for further upside but nearing overbought territory.
Trade Idea:
Buy Entry: If the stock sustains a breakout above ₹1,111, it could lead to further gains towards ₹1,200 or higher.
Stop Loss: Place a stop loss below ₹955.50 to manage risk.
Take Profit: Look for targets around ₹1,200–₹1,250 if the breakout continues with strong volume.
Given the upward trend, this setup offers a potential positional trade with a favorable risk-to-reward ratio, provided the stock breaks resistance with momentum.
Swing Trade Set UPA simple, Swing Trade Set UP. Often it is simple trade setup that make lots of money. This is one such set up. Here trend is captured with alignment of MA's . 3 MAs are plotted EMA-10, EAM-21 and SMA 50. To pick the trend, first condition is EMA-10 > EMA-21 > SMA 50. Second condition is price above all these MAs. In the chart it is marked wherever this occurred.
Now to make entry you have to wait till the stock out performs the Index. It can be captured through plotting a indicator named RS or Relative strength. use Bench mark index as #NIFTY50 or #CNX500.
You can see that there are areas where MAs aligned but RS was negative and trend failed. But when all these aligned price moved up nicely. You can exit the trade on deceive break of EMA 21 or SMA 50.
Try this on many charts and lean the nuance before making actual trade.

50 SMA Rising - Positional TradeDisclaimer: I am not a Sebi registered adviser.
This Idea is publish purely for educational purpose only before investing in any stocks please take advise from your financial adviser.
Its 50 SMA Rising Strategy. Suitable for Positional Trading Initial Stop loss lowest of last 2 candles and keep trailing with 50 days SMA if price close below 50 SMA then Exit or be in the trade some time trade can go for several months.
Be Discipline because discipline is the Key to Success in the STOCK Market.
Trade What you see not what you Think

Deepak Fertilizers Deepak Fertilizers is an undervalued stock and 2 years breakout was completed and a retest was done. We can expect a huge uptrend in the coming days.
Target-1 = 1150
Target-2 = 1255
Target-3 = 1375
Stop Loss should be 985.
Taken Position at 1050.
Let's see.

Deepak Fertilizer Ltd *Deepak Fertilizer Ltd*
RB Formation on Yearly Basis.
Bounce back from Retracement levels.
Strong Vol Consolidation & continued BuiltUp.
RSI: 1H >DM
EMAs: Widening Gaps amongst 20/ 50/ 100/ 200 levels on Monthly Basis.
*Trail SL with Upside*
*Book Profit as per Risk Appetite*
Normal Monsoons / Higher soing vs PY to boost demand of Fertilizers.
*Do your own research as well. This is an Opinion*
*_Happy Investing_*🤓

DEEPAK FERTILIZERS & PETR S/RSupport and Resistance Levels:
Support Levels: These are price points (green line/share) where a downward trend may be halted due to a concentration of buying interest. Imagine them as a safety net where buyers step in, preventing further decline.
Resistance Levels: Conversely, resistance levels (red line/shade) are where upward trends might stall due to increased selling interest. They act like a ceiling where sellers come in to push prices down.
Breakouts:
Bullish Breakout: When the price moves above resistance, it often indicates strong buying interest and the potential for a continued uptrend. Traders may view this as a signal to buy or hold.
Bearish Breakout: When the price falls below support, it can signal strong selling interest and the potential for a continued downtrend. Traders might see this as a cue to sell or avoid buying.
20 EMA (Exponential Moving Average):
Above 20 EMA: If the stock price is above the 20 EMA, it suggests a potential uptrend or bullish momentum.
Below 20 EMA: If the stock price is below the 20 EMA, it indicates a potential downtrend or bearish momentum.
Trendline: A trendline is a straight line drawn on a chart to represent the general direction of a data point set.
Uptrend Line: Drawn by connecting the lows in an upward trend. Indicates that the price is moving higher over time. Acts as a support level, where prices tend to bounce upward.
Downtrend Line: Drawn by connecting the highs in a downward trend. Indicates that the price is moving lower over time. It acts as a resistance level, where prices tend to drop.
RSI: RSI readings greater than the 70 level are overbought territory, and RSI readings lower than the 30 level are considered oversold territory.
Combining RSI with Support and Resistance:
Support Level: This is a price level where a stock tends to find buying interest, preventing it from falling further. If RSI is showing an oversold condition (below 30) and the price is near or at a strong support level, it could be a good buy signal.
Resistance Level: This is a price level where a stock tends to find selling interest, preventing it from rising further. If RSI is showing an overbought condition (above 70) and the price is near or at a strong resistance level, it could be a signal to sell or short the asset.
Disclaimer:
I am not a SEBI registered. The information provided here is for learning purposes only and should not be interpreted as financial advice. Consider the broader market context and consult with a qualified financial advisor before making investment decisions.

DEEPAK FERTILIZERS - Price Action⚠️Disclaimer: We are not registered advisors. The views expressed here are merely personal opinions. Irrespective of the language used, Nothing mentioned here should be considered as advice or recommendation. Please consult with your financial advisors before making any investment decisions. Like everybody else, we too can be wrong at times
