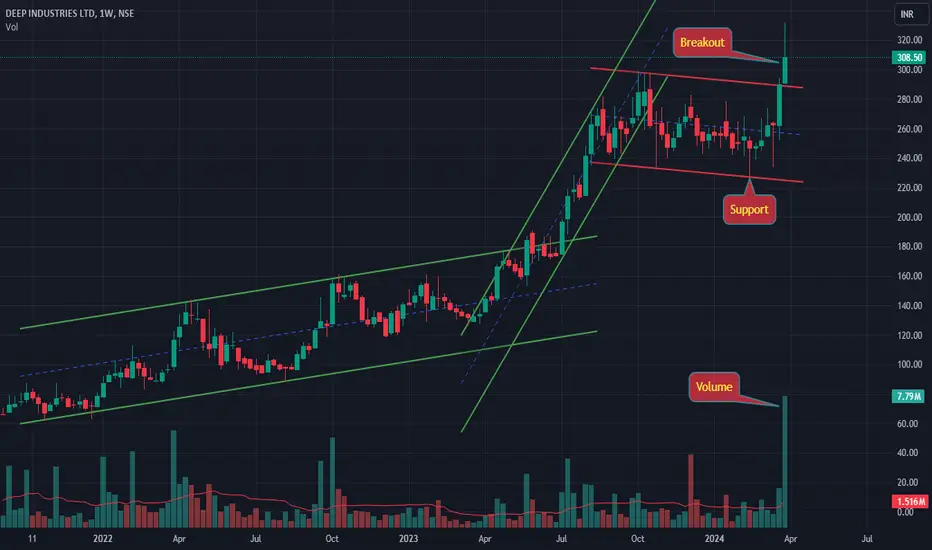
Darvas Box Strategy - Break out Stock - Swing TradeDisclaimer: I am Not SEBI Registered adviser, please take advise from your financial adviser before investing in any stocks. Idea here shared is for education purpose only.
Stock has given break out. Buy above high. Keep this stock in watch list.
Buy above the High and do not forget to keep stop lo
−14.10 INR
−901.03 M INR
5.76 B INR
19.99 M
About DEEP INDUSTRIES LTD
Sector
Industry
Website
Headquarters
Ahmedabad
Founded
2006
ISIN
INE0FHS01024
FIGI
BBG00L1BCCN2
Deep Industries Ltd. engages in oil and gas exploration services. It operates in two business segments: Oil and Gas Services Business segment which is comprised of air and natural gas compression services, gas dehydration, work over and drilling rig services and oil & gas exploration and production segment. The company was founded on November 15, 2006 and is headquartered in Ahmedabad, India.
Related stocks

DEEP INDUSTRIES LTD S/R Support and Resistance Levels:
Support Levels: These are price points (green line/shade) where a downward trend may be halted due to a concentration of buying interest. Imagine them as a safety net where buyers step in, preventing further decline.
Resistance Levels: Conversely, resistance levels (re

Lone red candle with big gap on weeklyLone red candle with big gap and high volume on the weekly chart.
Topping signs?
Watch out for gap fill in the coming weeks. If the gap is filled, path of least resistance is back to previous Support/Resistance zone.

DEEP INDUSTRIESSymmetrical Triangle pattern
70% Probability to go upside
This is just for educational purpose


DEEPINDS again giving an entry point
Sure, here's a description of why you might want to buy DEEPINDS:
Discover the Power of DEEPINDS: Elevating Your Digital Experience
In a world where information is abundant but insight is scarce, DEEPINDS emerges as the beacon of intelligent discovery. Imagine a tool that not only sifts through o

DEEPINDSStock name = Deep Industries Limited.
Weekly chart setup
Chart is self explanatory. Levels of breakout, possible up-moves (where stock may find resistances) and support (close below which, setup will be invalidated) are clearly defined.
Master Score - B
Disclaimer: This is for demonstration and ed
DEEP industriesChart is looking strong on weekly time frame and it is in uptrend
Company is working into Oil and Gas service industry. ONGC, Gail and many other companies are their customers (Source their website).
Symmetrical Triangle pattern observed - That is sign of trend continuation pattern further upside.


Deep Industries
Looking good after weekly closing above 288 (gann levels) and this provides a good RR (SL below 288) and targets being 350 and 420

See all ideas
Summarizing what the indicators are suggesting.
Oscillators
Neutral
SellBuy
Strong sellStrong buy
Strong sellSellNeutralBuyStrong buy
Oscillators
Neutral
SellBuy
Strong sellStrong buy
Strong sellSellNeutralBuyStrong buy
Summary
Neutral
SellBuy
Strong sellStrong buy
Strong sellSellNeutralBuyStrong buy
Summary
Neutral
SellBuy
Strong sellStrong buy
Strong sellSellNeutralBuyStrong buy
Summary
Neutral
SellBuy
Strong sellStrong buy
Strong sellSellNeutralBuyStrong buy
Moving Averages
Neutral
SellBuy
Strong sellStrong buy
Strong sellSellNeutralBuyStrong buy
Moving Averages
Neutral
SellBuy
Strong sellStrong buy
Strong sellSellNeutralBuyStrong buy
Displays a symbol's price movements over previous years to identify recurring trends.
Frequently Asked Questions
The current price of DEEPINDS is 465.25 INR — it has decreased by −1.64% in the past 24 hours. Watch DEEP INDUSTRIES LTD stock price performance more closely on the chart.
Depending on the exchange, the stock ticker may vary. For instance, on NSE exchange DEEP INDUSTRIES LTD stocks are traded under the ticker DEEPINDS.
DEEPINDS stock has risen by 3.19% compared to the previous week, the month change is a 12.17% rise, over the last year DEEP INDUSTRIES LTD has showed a 50.49% increase.
DEEPINDS reached its all-time high on Jan 8, 2025 with the price of 624.40 INR, and its all-time low was 16.90 INR and was reached on Apr 27, 2021. View more price dynamics on DEEPINDS chart.
See other stocks reaching their highest and lowest prices.
See other stocks reaching their highest and lowest prices.
DEEPINDS stock is 4.62% volatile and has beta coefficient of 1.58. Track DEEP INDUSTRIES LTD stock price on the chart and check out the list of the most volatile stocks — is DEEP INDUSTRIES LTD there?
Today DEEP INDUSTRIES LTD has the market capitalization of 30.55 B, it has increased by 2.73% over the last week.
Yes, you can track DEEP INDUSTRIES LTD financials in yearly and quarterly reports right on TradingView.
DEEPINDS net income for the last quarter is −2.09 B INR, while the quarter before that showed 436.06 M INR of net income which accounts for −579.69% change. Track more DEEP INDUSTRIES LTD financial stats to get the full picture.
Yes, DEEPINDS dividends are paid annually. The last dividend per share was 2.44 INR. As of today, Dividend Yield (TTM)% is 0.51%. Tracking DEEP INDUSTRIES LTD dividends might help you take more informed decisions.
EBITDA measures a company's operating performance, its growth signifies an improvement in the efficiency of a company. DEEP INDUSTRIES LTD EBITDA is 2.31 B INR, and current EBITDA margin is 40.18%. See more stats in DEEP INDUSTRIES LTD financial statements.
Like other stocks, DEEPINDS shares are traded on stock exchanges, e.g. Nasdaq, Nyse, Euronext, and the easiest way to buy them is through an online stock broker. To do this, you need to open an account and follow a broker's procedures, then start trading. You can trade DEEP INDUSTRIES LTD stock right from TradingView charts — choose your broker and connect to your account.
Investing in stocks requires a comprehensive research: you should carefully study all the available data, e.g. company's financials, related news, and its technical analysis. So DEEP INDUSTRIES LTD technincal analysis shows the buy rating today, and its 1 week rating is buy. Since market conditions are prone to changes, it's worth looking a bit further into the future — according to the 1 month rating DEEP INDUSTRIES LTD stock shows the buy signal. See more of DEEP INDUSTRIES LTD technicals for a more comprehensive analysis.
If you're still not sure, try looking for inspiration in our curated watchlists.
If you're still not sure, try looking for inspiration in our curated watchlists.