Darvas Box Strategy - Break out Stock - Swing TradeDisclaimer: I am Not SEBI Registered adviser, please take advise from your financial adviser before investing in any stocks. Idea here shared is for education purpose only.
Stock has given break out. Buy above high. Keep this stock in watch list.
Buy above the High and do not forget to keep stop loss, best suitable for swing trading.
Target and Stop loss Shown on Chart. Risk to Reward Ratio/ Target Ratio 1:2
Stop loss can be Trail when it make new box / Swing.
Be Discipline, because discipline is the key to Success in Stock Market.
Trade what you See Not what you Think.
DEEPINDS trade ideas

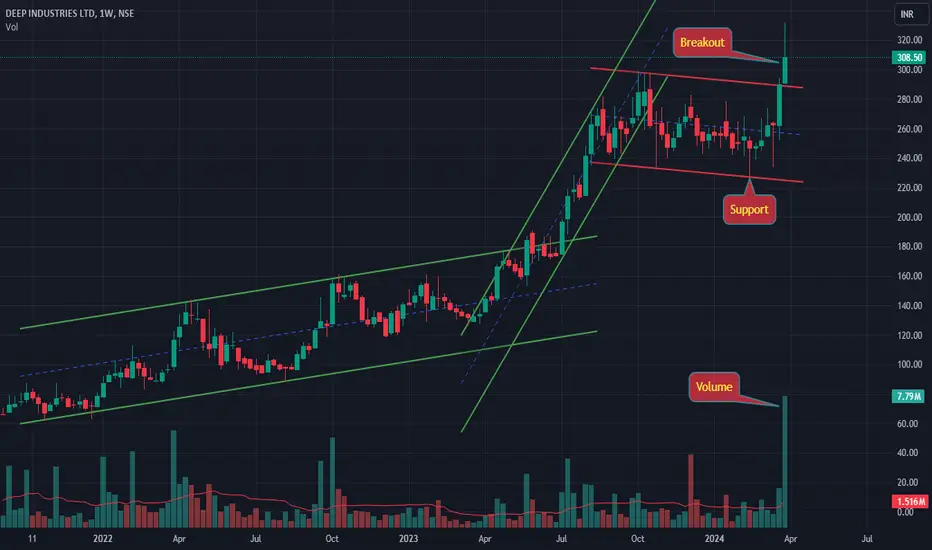
DEEP INDUSTRIES LTD S/R Support and Resistance Levels:
Support Levels: These are price points (green line/shade) where a downward trend may be halted due to a concentration of buying interest. Imagine them as a safety net where buyers step in, preventing further decline.
Resistance Levels: Conversely, resistance levels (red line/shade) are where upward trends might stall due to increased selling interest. They act like a ceiling where sellers come in to push prices down.
Breakouts:
Bullish Breakout: When the price moves above resistance, it often indicates strong buying interest and the potential for a continued uptrend. Traders may view this as a signal to buy or hold.
Bearish Breakout: When the price falls below support, it can signal strong selling interest and the potential for a continued downtrend. Traders might see this as a cue to sell or avoid buying.
20 EMA (Exponential Moving Average):
Above 20 EMA: If the stock price is above the 20 EMA, it suggests a potential uptrend or bullish momentum.
Below 20 EMA: If the stock price is below the 20 EMA, it indicates a potential downtrend or bearish momentum.
Trendline: A trendline is a straight line drawn on a chart to represent the general direction of a data point set.
Uptrend Line: Drawn by connecting the lows in an upward trend. Indicates that the price is moving higher over time. Acts as a support level, where prices tend to bounce upward.
Downtrend Line: Drawn by connecting the highs in a downward trend. Indicates that the price is moving lower over time. It acts as a resistance level, where prices tend to drop.
RSI: RSI readings greater than the 70 level are overbought territory, and RSI readings lower than the 30 level are considered oversold territory.
Combining RSI with Support and Resistance:
Support Level: This is a price level where a stock tends to find buying interest, preventing it from falling further. If RSI is showing an oversold condition (below 30) and the price is near or at a strong support level, it could be a good buy signal.
Resistance Level: This is a price level where a stock tends to find selling interest, preventing it from rising further. If RSI is showing an overbought condition (above 70) and the price is near or at a strong resistance level, it could be a signal to sell or short the asset.
Disclaimer:
I am not a SEBI registered. The information provided here is for learning purposes only and should not be interpreted as financial advice. Consider the broader market context and consult with a qualified financial advisor before making investment decisions.

Lone red candle with big gap on weeklyLone red candle with big gap and high volume on the weekly chart.
Topping signs?
Watch out for gap fill in the coming weeks. If the gap is filled, path of least resistance is back to previous Support/Resistance zone.

DEEP INDUSTRIESSymmetrical Triangle pattern
70% Probability to go upside
This is just for educational purpose


DEEPINDS again giving an entry point
Sure, here's a description of why you might want to buy DEEPINDS:
Discover the Power of DEEPINDS: Elevating Your Digital Experience
In a world where information is abundant but insight is scarce, DEEPINDS emerges as the beacon of intelligent discovery. Imagine a tool that not only sifts through oceans of data but also illuminates the hidden gems within, empowering you to make informed decisions and unlock unprecedented opportunities. Here's why DEEPINDS is not just another software, but an essential investment in your digital journey:
1. Unparalleled Insight: DEEPINDS harnesses the latest advancements in artificial intelligence and machine learning to delve deeper into your data than ever before. By analyzing patterns, trends, and correlations, it uncovers insights that are invisible to the naked eye, providing you with a strategic advantage in a competitive landscape.
2. Actionable Intelligence: Beyond mere analysis, DEEPINDS translates raw data into actionable intelligence. Whether you're a business leader seeking to optimize operations, a marketer aiming to target the right audience, or a researcher exploring new frontiers, DEEPINDS equips you with the knowledge to drive tangible outcomes.
3. Adaptive Learning: One size fits none in the dynamic digital ecosystem. Recognizing this, DEEPINDS continuously learns and adapts to evolving circumstances, ensuring that its recommendations remain relevant and impactful. Whether your goals shift or your environment changes, DEEPINDS remains your steadfast ally in navigating uncertainty.
4. Streamlined Efficiency: Time is of the essence in today's fast-paced world. DEEPINDS streamlines your workflows, automating repetitive tasks and surfacing insights in real-time. By reducing manual effort and minimizing guesswork, it liberates your team to focus on high-value initiatives that propel your organization forward.
5. Ethical and Transparent: Trust is paramount in the realm of data-driven decision-making. DEEPINDS upholds the highest standards of ethics and transparency, ensuring that your data remains secure and your privacy protected. With DEEPINDS, you can harness the power of AI with confidence, knowing that integrity lies at the heart of every recommendation.
6. Future-Proof Investment: In an era of rapid technological evolution, investing in DEEPINDS is not just about addressing current needs but also future-proofing your organization. With a roadmap driven by innovation and a commitment to staying ahead of the curve, DEEPINDS ensures that you're always primed for what lies ahead.
In a nutshell, DEEPINDS transcends conventional analytics tools, offering a transformative approach to data-driven decision-making. By unlocking the full potential of your data, DEEPINDS empowers you to seize opportunities, mitigate risks, and chart a course towards sustainable success in an ever-changing world. Experience the power of DEEPINDS today and redefine what's possible in your digital journey.

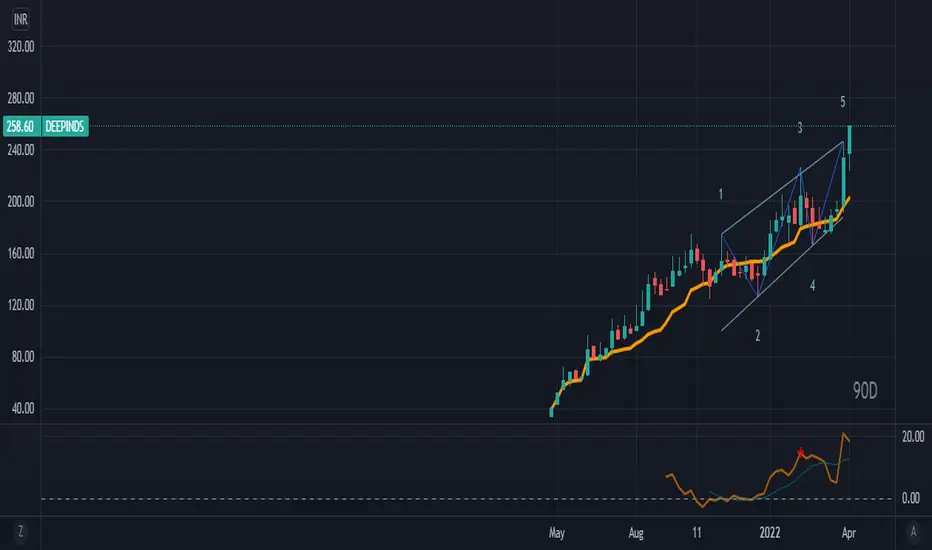
DEEPINDSStock name = Deep Industries Limited.
Weekly chart setup
Chart is self explanatory. Levels of breakout, possible up-moves (where stock may find resistances) and support (close below which, setup will be invalidated) are clearly defined.
Master Score - B
Disclaimer: This is for demonstration and educational purpose only. this is not buying and selling recommendations. I am not SEBI registered. please consult your financial advisor before taking any trade.
DEEP industriesChart is looking strong on weekly time frame and it is in uptrend
Company is working into Oil and Gas service industry. ONGC, Gail and many other companies are their customers (Source their website).
Symmetrical Triangle pattern observed - That is sign of trend continuation pattern further upside.
Also, 50 EMA support taken on weekly time frame as seen in chart.
This chart is only for educational purpose do your own study before taking any trades.


Deep Industries
Looking good after weekly closing above 288 (gann levels) and this provides a good RR (SL below 288) and targets being 350 and 420

DEEPINDS
NSE Symbol: DEEPINDS
Buy Abv 272 stop loss 263.
T1 297
T2 332
Disclaimer: I am not a financial advisor, and this information should not be considered financial advice. Please consult with a qualified financial advisor before making any investment decisions.
Remember: This information is for educational purposes only and shouldn't be taken as financial advice. Always do your own research and consult with a qualified financial advisor before making any investment decisions.

Engine is getting heated for a run #SuperchartzKey Levels:
Support: 240
Resistance: 300 350
Read the write-up:
1. **Positive Momentum**: An uptrend breakout signals a shift in momentum from consolidation to upward movement, indicating potential gains for traders and investors.
2. **Confirmation of Strength**: A successful BO confirms the underlying strength of the uptrend, validating the trend's sustainability and attracting more participants to the market.
3. **Entry Point**: Traders often use BOs as entry points to establish new positions, taking advantage of the increased potential for price appreciation in the ongoing uptrend.
4. **Technical Breakout**: Uptrend BOs often breach key resistance levels, serving as technical signals to traders that the market is overcoming hurdles and continuing its upward trajectory.
5. **Psychological Impact**: Uptrend BOs can have a psychological impact on market participants, boosting confidence and attracting more buyers, potentially fueling further price increases.
6. **Volume Confirmation**: A surge in trading volume during an uptrend BO provides additional confirmation of market participants' interest and conviction in the upward movement.
7. **Trend Continuation**: An uptrend BO suggests that the existing trend is likely to continue, offering traders an opportunity to ride the trend and potentially capitalize on extended gains.
8. **Breakout Patterns**: Various chart patterns, such as flags, pennants, or ascending triangles, can lead to uptrend BOs, offering traders the ability to spot potential opportunities.
9. **Risk Management**: Traders often place stop-loss orders below the breakout point, helping to manage risk and protect their investments if the breakout fails.
10. **Investor Attention**: A notable uptrend BO can attract media coverage and investor attention, potentially leading to increased market activity and liquidity.
Remember, while uptrend BOs can offer attractive opportunities, it's important to consider other factors, such as overall market conditions, fundamental analysis, and risk tolerance, before making trading decisions.

Deep Industries-Nice breakout.Deep Industries-Nice breakout.
Capital to be deployed- 20k
Investing Price -189-193
Breakout Price -186
Stoploss-155
Targets-291-405
#deepindustries #StockMarket #StockMarketindia #stockmarkets #StocksToBuy #stockmarketcrash #StockToWatch #StocksInFocus #stockmarketnews

SARAVANAN SHORT TERM BREAKOUT STOCKPick of the Week!
🟢Deep Ind🟢
1- Ascending Triangle BO Done
2- Nice Volume Buildup Seen
3- ATH Breakout Done
Keep on Radar.
Good Looking Stock!

Strong Momentum Stock !! Deep Industries Ltd.As on Chart Analysis Stock Gained more than 20 % in one Month
Stock Break Previous high, and make new all time high @ 167.85
now stock can Retest B.O level and set to Jump again .....
That Can Move 161/163 to 180, above in coming days ....
SL 136
( Company's Fundamentals are Good )
only Educational purpose ...

Deep Industries Limited - Cup & Handle Breakout📊 Script: DEEPINDS (DEEP INDUSTRIES LIMITED)
📊 Nifty50 Stock: NO
📊 Sectoral Index: N/A
📊 Sector: Energy Oil Gas & Consumable Fuels
📊 Industry: Offshore Support Solution Drilling
Key highlights: 💡⚡
📈 Script is trading at upper band of Bollinger Bands (BB) and giving breakout of it.
📈 MACD is giving crossover.
📈 Already crossover in Double Moving Averages.
📈 Volume is increasing along with price which is volume breakout.
📈 Script is giving breakout of Cup & Handle pattern.
📈 Current RSI is around 72.
📈 One can go for Swing Trade.
⏱️ C.M.P 📑💰- 297.95
🟢 Target 🎯🏆 - 340
⚠️ Stoploss ☠️🚫 - 274
⚠️ Important: Always maintain your Risk & Reward Ratio.
⚠️ Purely technical based pick.
✅Like and follow to never miss a new idea!✅
Disclaimer: I am not SEBI Registered Advisor. My posts are purely for training and educational purposes.
Eat🍜 Sleep😴 TradingView📈 Repeat🔁
Happy learning with trading. Cheers!🥂

DEEP Industries: soon to breakoutDeep Industries is a potential breakout candidate! Keep it on your radar!

deep ind - rising wedge b/o rising wedge b/o on weekly charts
ATH, rising oil prices, more investment needed, more orders for Deep
Mar 29
Deep Industries Wins ONGC Order Worth Rs 72 Crore will increase the revenue of the company
Cup and Handle baseThought process on charts.
Entered right at the pivot.
Not an investment/trading advise.

positiongood flag
less than book value
good pe
good for positional trade.......................but the company have high debtor ratios for past days
