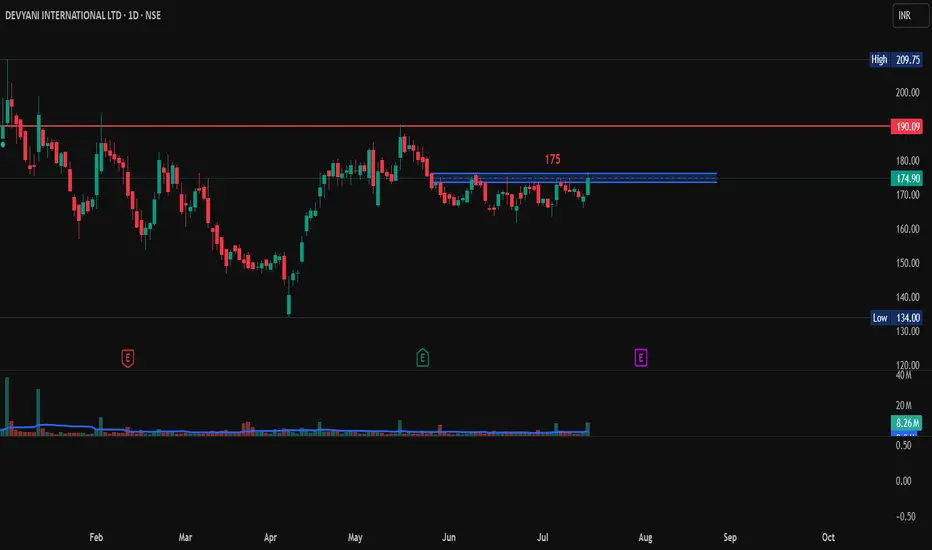
Devyani International Ltd., Long Trade, 1D Time FrameDevyani International limited so showing a good volume and is 3% up from its last day price. It has a resistance above 175. So if it breaks 175 with a good bullish candle then it may go long from here.
Entry: 175 If shows a good bullish candle stick pattern.
Target: 190 and above.
SL: 169.
Next report date
—
Report period
—
EPS estimate
—
Revenue estimate
—
1,413.60
0.12 INR
91.49 M INR
49.38 B INR
423.12 M
About DEVYANI INTERNATIONAL LTD
Sector
Industry
CEO
Virag Joshi
Website
Headquarters
Gurugram
Founded
1991
ISIN
INE872J01023
FIGI
BBG011ZXYQ46
Devyani International Ltd. engages in the development and operation of quick service restaurant. It operates through Within India and Outside India segments. The company was founded on December 13, 1991 and is headquartered in Gurugram, India.
Related stocks
should move to 220+based on the horizontal support for descending triangle with upward trend continuation, the pattern should breakout anytime for brisk move to the target.

Devyani - Cup PatternDevyani International Ltd.
Forming a CUP Pattern in Daily Timeframe.
50-day SMA crossed 200-day SMA from below.
Within 52 week high zone.
Outperforming Sectoral Index.
Making Higher Highs for 2 days.
Disclaimer:
For educational purpose only.
Please do your own research before taking any trades.
H

Amazing breakout on WEEKLY Timeframe - DEVYANICheckout an amazing breakout happened in the stock in Weekly timeframe, macroscopically seen in Daily timeframe. Having a great favor that the stock might be bullish expecting a staggering returns of minimum 25% TGT. IMPORTANT BREAKOUT LEVELS ARE ALWAYS RESPECTED!
NOTE for learners: Place the break

DEVYANINSE:DEVYANI
Note :
1. One should go long with a Stop Loss, below the Trendline or the Previous Swing Low.
2. Risk :Reward ratio should be minimum 1:2.
3. Plan your trade as per the Money Mangement and Risk Appetite.
Disclamier : You are responsible for your profits and loss.
The idea shared h


DEVYANI CMP 170DEVYANI International support a support trendline and making higher lows. We can see this for a Swing trade .Low Risk High Reward Setup is making.We can see next levels from here- 180......190......200.Analyze Before entry.See how it perform from here in coming days.Thanks for support.

mega Star Double CandidateThe accumulation/distribution (A/D) line gauges supply and demand of an asset or security by looking at where the price closed within the period’s range and then multiplying that by volume.
The A/D indicator is cumulative, meaning one period’s value is added or subtracted from the last.
In general,

Devyani International can give a tasty breakout. Devyani International Ltd. engages in the development and operation of quick service restaurant. It operates through Within India and Outside India segments. The company manages brands like Costa Coffee, KFC, Pizza Hut, Vangoo and The Good Street.
Devyani International Ltd. CMP is 172.37. The Posi

Key Support & Resistance Breakout - Swing TradeDisclaimer: I am not a Sebi registered adviser.
This Idea is publish purely for educational purpose only before investing in any stocks please take advise from your financial adviser.
Key Support & Resistance Breakout. Stock has give Breakout of Resistance level. Keep in watch list. Buy above the h

See all ideas
Summarizing what the indicators are suggesting.
Neutral
SellBuy
Strong sellStrong buy
Strong sellSellNeutralBuyStrong buy
Neutral
SellBuy
Strong sellStrong buy
Strong sellSellNeutralBuyStrong buy
Neutral
SellBuy
Strong sellStrong buy
Strong sellSellNeutralBuyStrong buy
An aggregate view of professional's ratings.
Neutral
SellBuy
Strong sellStrong buy
Strong sellSellNeutralBuyStrong buy
Neutral
SellBuy
Strong sellStrong buy
Strong sellSellNeutralBuyStrong buy
Neutral
SellBuy
Strong sellStrong buy
Strong sellSellNeutralBuyStrong buy
Displays a symbol's price movements over previous years to identify recurring trends.
Curated watchlists where DEVYANI is featured.

Frequently Asked Questions
The current price of DEVYANI is 171.76 INR — it has decreased by −1.62% in the past 24 hours. Watch DEVYANI INTERNATIONAL LTD stock price performance more closely on the chart.
Depending on the exchange, the stock ticker may vary. For instance, on NSE exchange DEVYANI INTERNATIONAL LTD stocks are traded under the ticker DEVYANI.
DEVYANI stock has fallen by −1.85% compared to the previous week, the month change is a 1.04% rise, over the last year DEVYANI INTERNATIONAL LTD has showed a −4.07% decrease.
We've gathered analysts' opinions on DEVYANI INTERNATIONAL LTD future price: according to them, DEVYANI price has a max estimate of 215.00 INR and a min estimate of 139.00 INR. Watch DEVYANI chart and read a more detailed DEVYANI INTERNATIONAL LTD stock forecast: see what analysts think of DEVYANI INTERNATIONAL LTD and suggest that you do with its stocks.
DEVYANI reached its all-time high on Sep 11, 2023 with the price of 227.50 INR, and its all-time low was 107.55 INR and was reached on Aug 23, 2021. View more price dynamics on DEVYANI chart.
See other stocks reaching their highest and lowest prices.
See other stocks reaching their highest and lowest prices.
DEVYANI stock is 2.03% volatile and has beta coefficient of 1.14. Track DEVYANI INTERNATIONAL LTD stock price on the chart and check out the list of the most volatile stocks — is DEVYANI INTERNATIONAL LTD there?
Today DEVYANI INTERNATIONAL LTD has the market capitalization of 211.83 B, it has increased by 0.96% over the last week.
Yes, you can track DEVYANI INTERNATIONAL LTD financials in yearly and quarterly reports right on TradingView.
DEVYANI INTERNATIONAL LTD is going to release the next earnings report on Jul 31, 2025. Keep track of upcoming events with our Earnings Calendar.
DEVYANI earnings for the last quarter are −0.10 INR per share, whereas the estimation was −0.11 INR resulting in a 10.26% surprise. The estimated earnings for the next quarter are 0.07 INR per share. See more details about DEVYANI INTERNATIONAL LTD earnings.
DEVYANI INTERNATIONAL LTD revenue for the last quarter amounts to 12.13 B INR, despite the estimated figure of 12.45 B INR. In the next quarter, revenue is expected to reach 13.59 B INR.
DEVYANI net income for the last quarter is −147.38 M INR, while the quarter before that showed −4.92 M INR of net income which accounts for −2.90 K% change. Track more DEVYANI INTERNATIONAL LTD financial stats to get the full picture.
No, DEVYANI doesn't pay any dividends to its shareholders. But don't worry, we've prepared a list of high-dividend stocks for you.
As of Jul 27, 2025, the company has 20.42 K employees. See our rating of the largest employees — is DEVYANI INTERNATIONAL LTD on this list?
EBITDA measures a company's operating performance, its growth signifies an improvement in the efficiency of a company. DEVYANI INTERNATIONAL LTD EBITDA is 8.42 B INR, and current EBITDA margin is 16.96%. See more stats in DEVYANI INTERNATIONAL LTD financial statements.
Like other stocks, DEVYANI shares are traded on stock exchanges, e.g. Nasdaq, Nyse, Euronext, and the easiest way to buy them is through an online stock broker. To do this, you need to open an account and follow a broker's procedures, then start trading. You can trade DEVYANI INTERNATIONAL LTD stock right from TradingView charts — choose your broker and connect to your account.
Investing in stocks requires a comprehensive research: you should carefully study all the available data, e.g. company's financials, related news, and its technical analysis. So DEVYANI INTERNATIONAL LTD technincal analysis shows the neutral today, and its 1 week rating is buy. Since market conditions are prone to changes, it's worth looking a bit further into the future — according to the 1 month rating DEVYANI INTERNATIONAL LTD stock shows the buy signal. See more of DEVYANI INTERNATIONAL LTD technicals for a more comprehensive analysis.
If you're still not sure, try looking for inspiration in our curated watchlists.
If you're still not sure, try looking for inspiration in our curated watchlists.