#Dishtv - Bullish Harmonic - Anti shark Pattern observed#Dishtv - Bullish Harmonic - Anti shark Pattern observed
Entry CMP - 12.5 SL on closing basis 10.9 Tgt 1 14.5, tgt 2 16.5
Disclosure : I am not SEBI registered.The information provided here is for education purposes only.I will not be responsible for any of your profit/loss with this channel suggestions.Consult your financial advisor before taking any decisions.Tweets neither advice nor endorsement.
Neither the information, nor any opinion contained in this page constitutes a solicitation or offer by the Group to buy or sell any securities, futures, options or other financial instruments or provide any investment advice or service.
DISHTV trade ideas

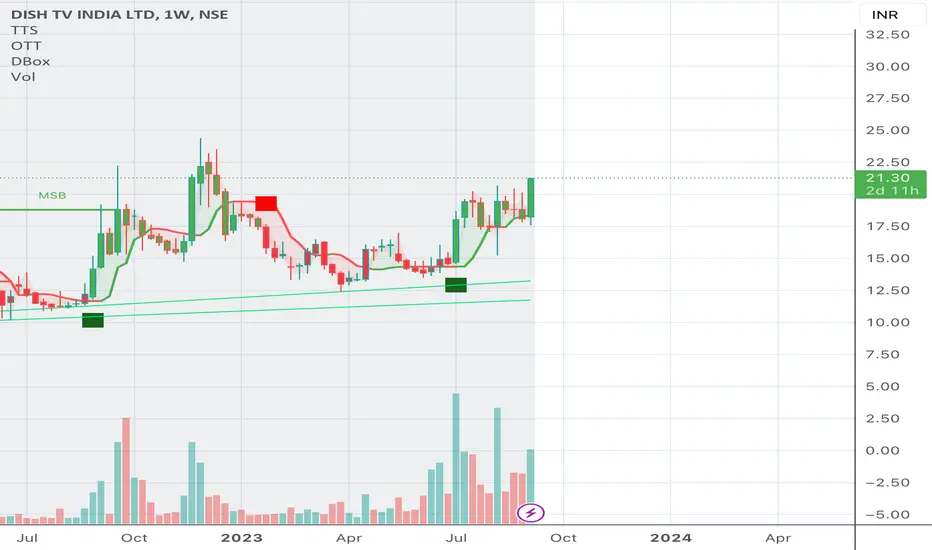
SWING IDEA - DISHTVNSE:DISHTV appears to be forming a Flag Pattern on its weekly chart, indicating potential upside momentum. Despite Monday's market downturn, the pattern has demonstrated resilience, maintaining support levels.
If the pattern holds, we can anticipate a continuation of the upward trend, targeting Swing High levels. This bullish outlook is further reinforced by the company's recent partnership with SEI ROBOTICS to launch the innovative 'DISH TV SMART+ BOX', integrating TV and OTT capabilities across devices.
Key takeaways:
- Flag Pattern formation on weekly chart
- Strong support levels despite market volatility
- Potential upside momentum towards Swing High levels
- Positive news catalyst: Partnership with SEI ROBOTICS for SMART+ BOX launch
Recommendation:
Investors and traders should monitor DISHTV's price action closely, as a breakout above the Flag Pattern's Support levels could trigger a significant move. We maintain a bullish stance, anticipating a potential revisit of Swing High levels in the near term.
Disclaimer: This analysis is for informational purposes only and should not be considered as investment advice. Please conduct thorough research and consult with a financial advisor before making any investment decisions.

Dishtv Near the major supportDishtv can double from here with in few years. Sl below the trend line.
Chart is self explanatory. Please follow the price action & take the trade as per your appetite.
The information provided here is only for educational purpose. The information provided here is not intended to be any kind of financial advice, investment advice, and trading advice. Investment in stock market is very risky and trading stocks, options and other securities involve risk. The risk of loss in stock market can be substantial. Moreover, I am not a SEBI registered analyst, so before taking any decision or before investing in any Share consult your financial advisor and also do your analysis and research.
Request your support and engagement by liking and commenting & follow to provide encouragement.


DISH TV - SHORT TERM IDEA , 100% ROI Expected.This is a reversal trade, although the stock is in a downtrend in Monthly time frame, it is in strong accumulation for the last 3 years.
Monthly time frame shows price contraction, lows are moving higher and is ready to move to the major resistance zone of 24.45.
For swing one can look for entry at 20rs zone - demand and look for a target of 24.45.
For short term one can look to add at 20 zone and wait for 40 target.

Dishtv , paisa double pick?Dishtv on a verge of breakout on a monthly timeframe at a good stage offering a good risk reward ratio
Only for risky traders and not for a investor
Risky traders can buy for 2x
For a cautious and a low risk low risk investor here is the detail thread
Buy range 20 to 25
Sl at 15
Tgt 35 50 80
Buy qty for low risk investor
Buy qty 400 shares
Investment amount 10,000
Sl at 15
Risk : 4,000
Potential gain as per tgt 4000, 10,000 & 10k +
Ask your financial advisor before buying only for educational purposes

Positive Divergence and increase in volume
In this stock we see that the RSI is moving upward and also there is central line crossover in MACD. Month by month we see increase in volume, stock recently closed above 23.35 which is strong resistance. Closes with good volume, so for long term view this stock may reach around 40. This is a best stock to have in a portfolio.

Dish TV: dishing out profits?the scrip is still in formation of VCP and such a long consolidation may give huge upside once it breaks out. a close above 24 is required on weekly basis.

long Dish tvThe TV has been making good volumes here
RSI breakout might happen next
Overall looks like it will go all time high. Lets see if it breaks the resistance.
Keep a tight SL on lover levels

DishTV Long PositionalBuy Dish TV above 22.5
for the Target of 24.30-26.60-28.90-31.05-33.50
SL 27.99
Strategy : SBO + RSI < 60 + EMA above 20 & 50
Duration few weeks

DISHTV, A breakout of 1600 days DISHTV has given a clear breakout on Monthly time frame with maximum volumes since Jan 2020


Weekly Elliot waves for Dish TVIn this age of internet and mobile entertainment, is there a scope of survival for a satellite television provider?
Well the above chart attempts to make a projection of the path the Dish TV stock can take in coming years based on the rules and guidelines of the Elliot wave theory.
To highlight the most important thing about it, the stock had a clean impulsive move from March 2020 bottom.
Note*- The chart is for educational and study purpose only.

Dish TV: Ready to Dish out some returns?The long VCP seems to be reaching its destination, a weekly closure above 24 with good volumes will confirm the same, if this played out well, we will be able to see the beauty of VCP, can easily become a doubler from here.

DISHTVGood volume seen in chart.
Can blast above the zone.
Disclaimer : This is not a Buy or Sell recommendation. Please consult your financial advisor before making any investments . This is for Educational purpose only


DishtvStock name = Dish Tv India Limited.
Weekly chart setup
Chart is self explanatory. Levels of breakout, possible up-moves (where stock may find resistances) and support (close below which, setup will be invalidated) are clearly defined.
Disclaimer: This is for demonstration and educational purpose only. this is not buying and selling recommendations. I am not SEBI registered. please consult your financial advisor before taking any trade.

Low price Good chart set-up
Ascending triangle chart set-up
Risk reward super
18 stoploss 24 Target 1:4
No recommendation for buy and sell

DISH TV DAILY CANDLE CHART...21.11.2023DISHTV forming Inverse Head and Shoulder pattern ,so expect up rally in short term same time keep focus on SL.

Broadening Wedge Pattern Reversal in DISHTVDISH TV INDIA LTD
Key highlights: 💡⚡
📊On 1Day Time Frame Stock Showing Reversal of Broadening Wedge Pattern.
📊 It can give movement upto the Reversal target of Above 23+.
📊There have chances of Breakout of Resistance level too.
📊 After Breakout of Resistance level this stock can gives strong upside rally upto above 30+.
📊 Can Go Long in this stock by placing stop loss below 14- or last swing Low.

DISHTV Long setup on weekly TFDISHTV long set up
If the prices cross 21.50 levels that would be the entry point with stop loss @ 16.30. With target 39, we can achieve over 3 risk reward ratio.
RSI has been hoovering above 60.
It looks like it has been making ascending triangle.

DISHTV LONG FOR 50 % GAIN IN A MONTHChart is self explanatory. Please follow the price action & take the trade as per your appetite.
The information provided here is only for educational purpose. The information provided here is not intended to be any kind of financial advice, investment advice, and trading advice. Investment in stock market is very risky and trading stocks, options and other securities involve risk. The risk of loss in stock market can be substantial. Moreover, I am not a SEBI registered analyst, so before taking any decision or before investing in any Share consult your financial advisor and also do your analysis and research.
Request your support and engagement by liking and commenting & follow to provide encouragement.
Bullish Candle and Resistance: DISHTV's Rally Towards 22DISHTV exhibited a notable bullish candlestick, concluding the day at a crucial daily resistance level. Provided the forthcoming days sustain and reinforce this robust bullish sentiment, it is likely that the ongoing surge will persist, propelling the stock's value higher towards the nearby daily swing point near 22.
