DIVISLAB Swing Trading For Swing Traders
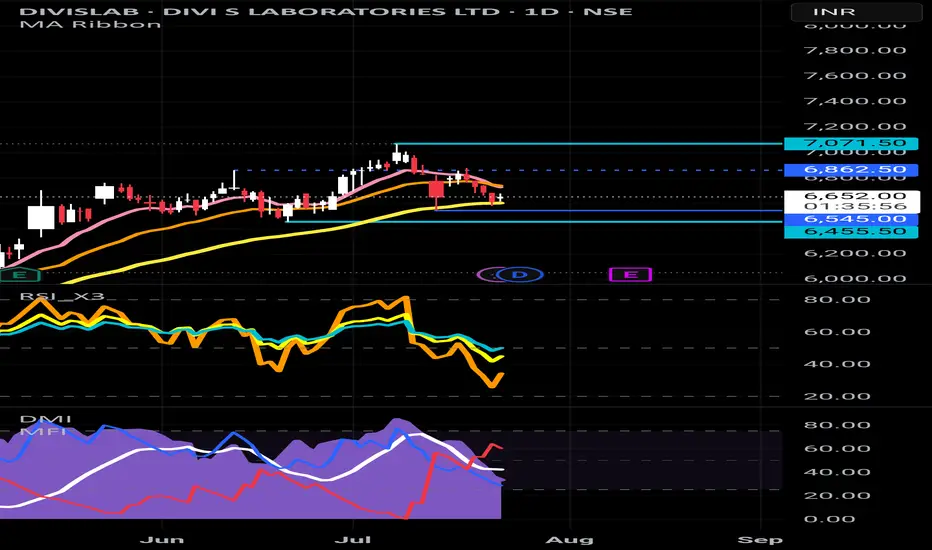
Entry Zone: ₹6,550–6,600 (if retested)
SL: Below ₹6,460 (structure + demand)
Target: ₹6,950–7,100
Risk: Moderate, as RSI and DMI are realigning upward.
For Investors / Position Traders
Hold with trailing SL below ₹6,100
Can add on dips around ₹6,200–6,300 (volume-backed demand
Next report date
—
Report period
—
EPS estimate
—
Revenue estimate
—
82.55 INR
21.91 B INR
93.58 B INR
126.63 M
About DIVI S LABORATORIES LTD
Sector
Industry
CEO
Satchandra Kiran Divi
Website
Headquarters
Hyderabad
Founded
1990
ISIN
INE361B01024
FIGI
BBG000DJVYM0
Divi's Laboratories Ltd. is a holding company, which engages in the manufacture of active pharmaceutical ingredients, intermediates, and nutraceutical. It also provides manufacturing of generic APIs, nutraceutical ingredients, and custom synthesis for big pharma. The company was founded by Murali Krishna Prasad Divi on October 12, 1990 and is headquartered in Hyderabad, India.
Related stocks
Divis Lab SellDivis Labarotoris breaks trend line. Sell @CMP (6590) with SL of 6703 and target of 6400

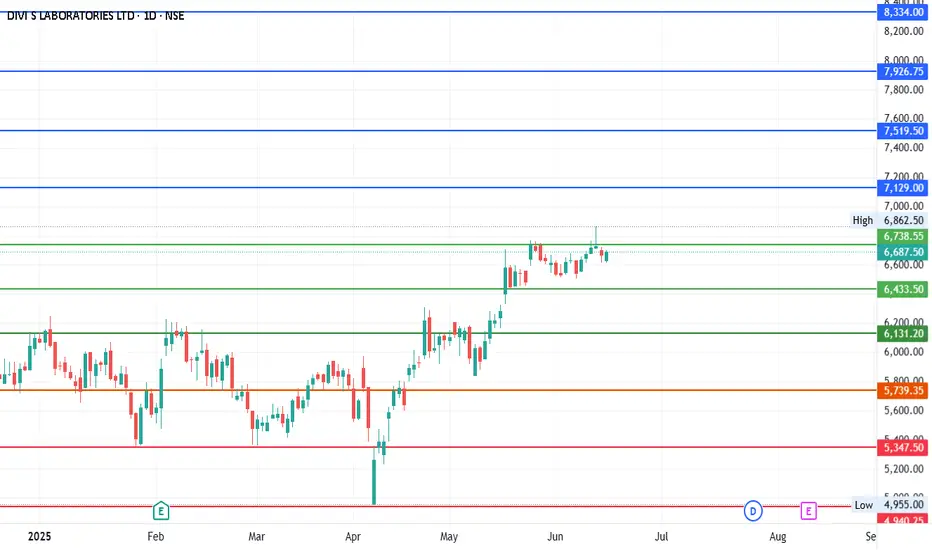
#DIVISLAB - Pivot Point is 6433.50Date: 20-05-2025
#Divislab Current Price: 6483
Pivot Point: 6433.50 Support: 6131.19 Resistance: 6738.53
#Divislab Upside Targets:
Target 1: 7129.01
Target 2: 7519.50
Target 3: 7926.75
Target 4: 8334.00
#Divislab Downside Targets:
Target 1: 57
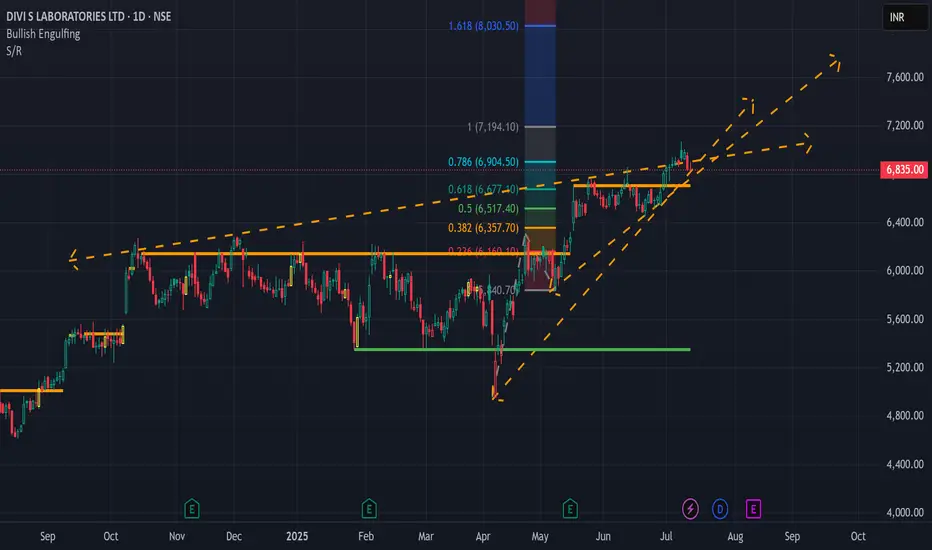
#DIVISLAB - 1000 POINTS MOVE EXPECTEDCurrent Price: 5942
Upside: 6456.34 6697.75 6954.63 7211.50
Downside: 5570.02 5327.75 5070.88 4814.00
Checkout all the levels marked in the chart
Pls comment whatever you observe.


DIVI’S LAB Weekly Chart – Primary Wave (3) in ProgressDIVI’S LAB is progressing within Primary Wave (3) after completing Wave (2) near ₹2,732. Intermediate Wave 5 (in red) is in play, targeting ₹7,400–₹8,000. Broader Primary Wave (3) may extend towards ₹10,250 based on 1.618 projection.
🌀 Primary Wave Count (Black Circles):
Wave (1): Topped near ₹

DIVI'S LAB: Made a new ATH of 6764 after a Buy Signal DIVI'S LAB: Made a new ATH of 6764 after a Buy signal ,surpassing 6500 .
Trend continues.
MACD is looking extremely strong.
( Not a Buy / Sell Recommendation
Do your own due diligence ,Market is subject to risks, This is my own view and for learning only .)

DIVI'S LAB: Touched an ATH of 6705 DIVI'S LAB: Touched an ATH of 6705 after a Buy triggered .
6705 could be considered as a fresh new Resistance .
( Not a Buy / Sell Recommendation
Do your own due diligence ,Market is subject to risks, This is my own view and for learning only .)

See all ideas
Summarizing what the indicators are suggesting.
Neutral
SellBuy
Strong sellStrong buy
Strong sellSellNeutralBuyStrong buy
Neutral
SellBuy
Strong sellStrong buy
Strong sellSellNeutralBuyStrong buy
Neutral
SellBuy
Strong sellStrong buy
Strong sellSellNeutralBuyStrong buy
An aggregate view of professional's ratings.
Neutral
SellBuy
Strong sellStrong buy
Strong sellSellNeutralBuyStrong buy
Neutral
SellBuy
Strong sellStrong buy
Strong sellSellNeutralBuyStrong buy
Neutral
SellBuy
Strong sellStrong buy
Strong sellSellNeutralBuyStrong buy
Displays a symbol's price movements over previous years to identify recurring trends.
Frequently Asked Questions
The current price of DIVISLAB is 6,616.50 INR — it has decreased by −0.03% in the past 24 hours. Watch DIVI S LABORATORIES LTD stock price performance more closely on the chart.
Depending on the exchange, the stock ticker may vary. For instance, on NSE exchange DIVI S LABORATORIES LTD stocks are traded under the ticker DIVISLAB.
DIVISLAB stock has fallen by −2.41% compared to the previous week, the month change is a 0.48% rise, over the last year DIVI S LABORATORIES LTD has showed a 46.06% increase.
We've gathered analysts' opinions on DIVI S LABORATORIES LTD future price: according to them, DIVISLAB price has a max estimate of 7,900.00 INR and a min estimate of 4,098.00 INR. Watch DIVISLAB chart and read a more detailed DIVI S LABORATORIES LTD stock forecast: see what analysts think of DIVI S LABORATORIES LTD and suggest that you do with its stocks.
DIVISLAB reached its all-time high on Jul 8, 2025 with the price of 7,071.50 INR, and its all-time low was 7.75 INR and was reached on Mar 12, 2003. View more price dynamics on DIVISLAB chart.
See other stocks reaching their highest and lowest prices.
See other stocks reaching their highest and lowest prices.
DIVISLAB stock is 1.26% volatile and has beta coefficient of 0.75. Track DIVI S LABORATORIES LTD stock price on the chart and check out the list of the most volatile stocks — is DIVI S LABORATORIES LTD there?
Today DIVI S LABORATORIES LTD has the market capitalization of 1.76 T, it has decreased by −0.17% over the last week.
Yes, you can track DIVI S LABORATORIES LTD financials in yearly and quarterly reports right on TradingView.
DIVI S LABORATORIES LTD is going to release the next earnings report on Aug 11, 2025. Keep track of upcoming events with our Earnings Calendar.
DIVISLAB earnings for the last quarter are 24.90 INR per share, whereas the estimation was 22.63 INR resulting in a 10.01% surprise. The estimated earnings for the next quarter are 22.29 INR per share. See more details about DIVI S LABORATORIES LTD earnings.
DIVI S LABORATORIES LTD revenue for the last quarter amounts to 25.85 B INR, despite the estimated figure of 25.62 B INR. In the next quarter, revenue is expected to reach 24.69 B INR.
DIVISLAB net income for the last quarter is 6.62 B INR, while the quarter before that showed 5.89 B INR of net income which accounts for 12.39% change. Track more DIVI S LABORATORIES LTD financial stats to get the full picture.
Yes, DIVISLAB dividends are paid annually. The last dividend per share was 30.00 INR. As of today, Dividend Yield (TTM)% is 0.45%. Tracking DIVI S LABORATORIES LTD dividends might help you take more informed decisions.
DIVI S LABORATORIES LTD dividend yield was 0.52% in 2024, and payout ratio reached 36.35%. The year before the numbers were 0.87% and 49.78% correspondingly. See high-dividend stocks and find more opportunities for your portfolio.
As of Jul 26, 2025, the company has 18.3 K employees. See our rating of the largest employees — is DIVI S LABORATORIES LTD on this list?
EBITDA measures a company's operating performance, its growth signifies an improvement in the efficiency of a company. DIVI S LABORATORIES LTD EBITDA is 29.68 B INR, and current EBITDA margin is 32.49%. See more stats in DIVI S LABORATORIES LTD financial statements.
Like other stocks, DIVISLAB shares are traded on stock exchanges, e.g. Nasdaq, Nyse, Euronext, and the easiest way to buy them is through an online stock broker. To do this, you need to open an account and follow a broker's procedures, then start trading. You can trade DIVI S LABORATORIES LTD stock right from TradingView charts — choose your broker and connect to your account.
Investing in stocks requires a comprehensive research: you should carefully study all the available data, e.g. company's financials, related news, and its technical analysis. So DIVI S LABORATORIES LTD technincal analysis shows the sell today, and its 1 week rating is buy. Since market conditions are prone to changes, it's worth looking a bit further into the future — according to the 1 month rating DIVI S LABORATORIES LTD stock shows the buy signal. See more of DIVI S LABORATORIES LTD technicals for a more comprehensive analysis.
If you're still not sure, try looking for inspiration in our curated watchlists.
If you're still not sure, try looking for inspiration in our curated watchlists.