DIVISLAB Swing Trading For Swing Traders
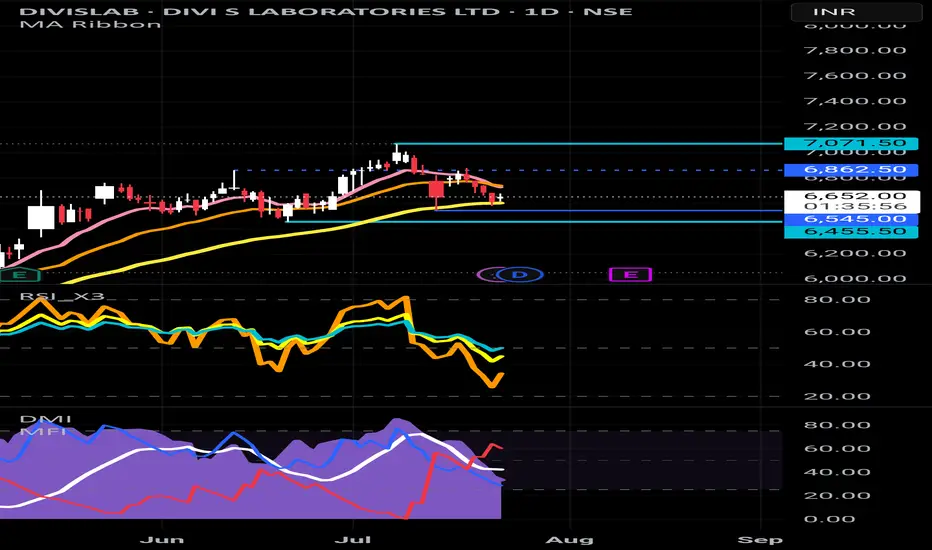
Entry Zone: ₹6,550–6,600 (if retested)
SL: Below ₹6,460 (structure + demand)
Target: ₹6,950–7,100
Risk: Moderate, as RSI and DMI are realigning upward.
For Investors / Position Traders
Hold with trailing SL below ₹6,100
Can add on dips around ₹6,200–6,300 (volume-backed demand zone)
Long-term uptrend intact on all timeframes.
DIVISLAB remains structurally bullish across all timeframes, with the recent dip forming a higher low near a well-established demand zone. Indicators suggest bullish strength returning, especially on the weekly and monthly scales. Current setup offers a good reward-to-risk swing opportunity, with positional investors best advised to hold or add on any dip towards ₹6,300–6,500.
DIVISLAB trade ideas
Divis Lab SellDivis Labarotoris breaks trend line. Sell @CMP (6590) with SL of 6703 and target of 6400

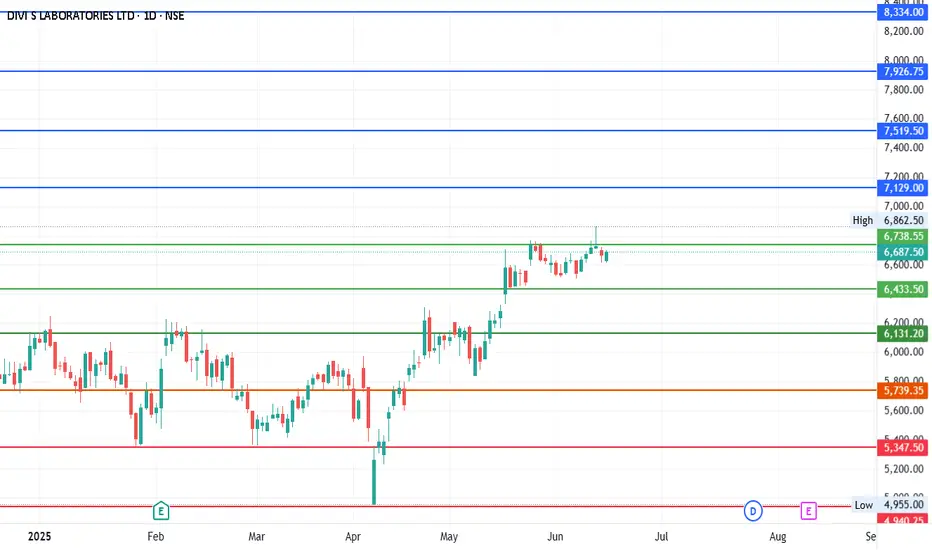
#DIVISLAB - Pivot Point is 6433.50Date: 20-05-2025
#Divislab Current Price: 6483
Pivot Point: 6433.50 Support: 6131.19 Resistance: 6738.53
#Divislab Upside Targets:
Target 1: 7129.01
Target 2: 7519.50
Target 3: 7926.75
Target 4: 8334.00
#Divislab Downside Targets:
Target 1: 5739.35
Target 2: 5347.5
Target 3: 4940.25
Target 4: 4533.00
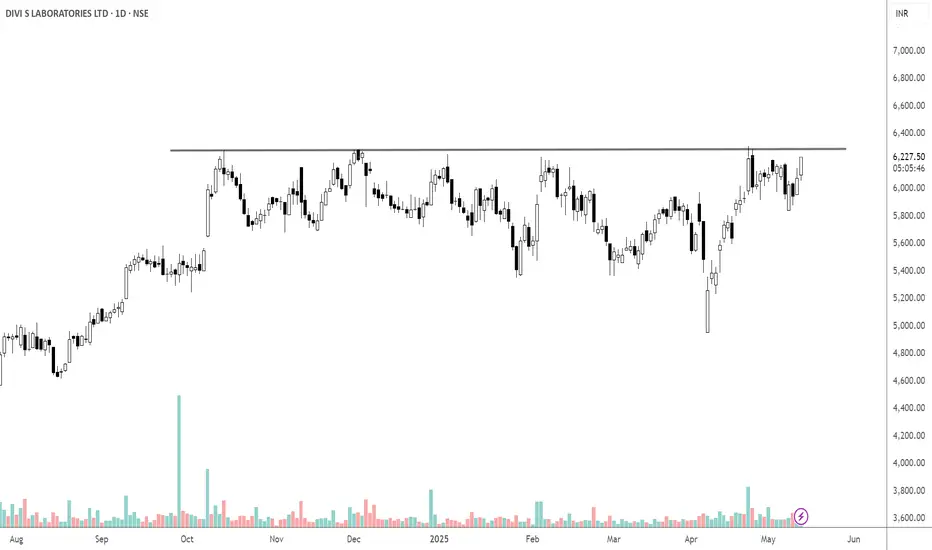
#DIVISLAB - 1000 POINTS MOVE EXPECTEDCurrent Price: 5942
Upside: 6456.34 6697.75 6954.63 7211.50
Downside: 5570.02 5327.75 5070.88 4814.00
Checkout all the levels marked in the chart
Pls comment whatever you observe.


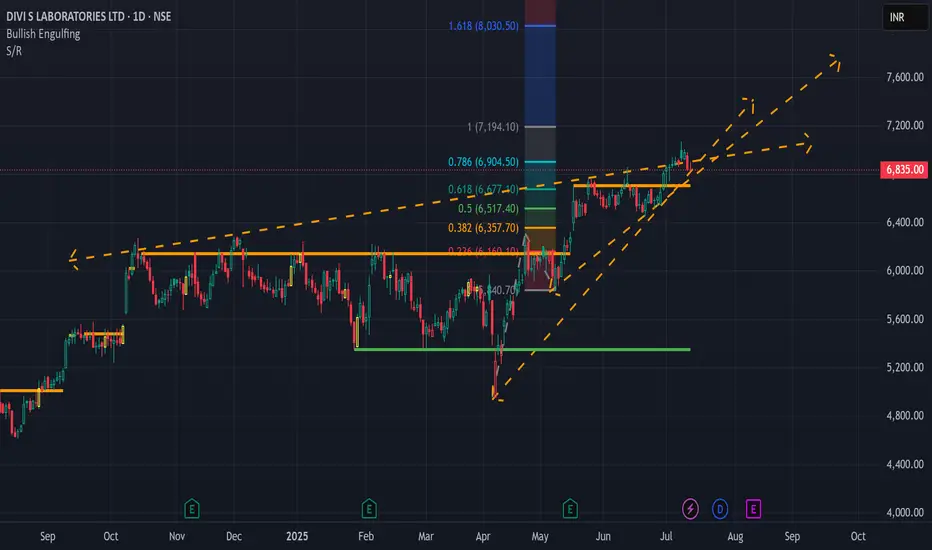
DIVI’S LAB Weekly Chart – Primary Wave (3) in ProgressDIVI’S LAB is progressing within Primary Wave (3) after completing Wave (2) near ₹2,732. Intermediate Wave 5 (in red) is in play, targeting ₹7,400–₹8,000. Broader Primary Wave (3) may extend towards ₹10,250 based on 1.618 projection.
🌀 Primary Wave Count (Black Circles):
Wave (1): Topped near ₹5,607
Wave (2): Bottomed near ₹2,732
Wave (3): Now underway and aiming for extended Fibonacci targets.
📈 Primary Wave (3) Fibonacci Extension Targets:
(Fib measured from Wave (1) low to high, and projected from Wave (2) bottom)
1.0 = ₹7,383
1.618 = ₹10,258
2.0 = ₹11,482 (not marked, but can be considered later)
🔴 Intermediate Waves Inside Primary Wave (3):
1.618 is the most common target in extended wave 3s of a primary degree.
The red-labeled wave count is the internal structure of this ongoing Primary Wave (3).
Wave 5 (red) is likely targeting ₹7,478–₹8,000 zone, which would then complete Intermediate Wave (3), not the larger Primary Wave (3).
✅ Conclusion:
Wave (3) still has room to extend much higher.
Key Target: ₹10,258 (1.618 Fib extension).
Current move is driven by Intermediate Wave 5 (red) within the larger Primary Wave (3).
🧠 Summary:
Stock: DIVI’S LAB
Chart Type: Weekly (NSE)
Structure: Impulsive rally in progress
Current Position: Inside Primary Wave (3), completing Intermediate Wave 5
Primary Target: ₹10,258 (1.618 Fib level)

DIVI'S LAB: Made a new ATH of 6764 after a Buy Signal DIVI'S LAB: Made a new ATH of 6764 after a Buy signal ,surpassing 6500 .
Trend continues.
MACD is looking extremely strong.
( Not a Buy / Sell Recommendation
Do your own due diligence ,Market is subject to risks, This is my own view and for learning only .)

DIVI'S LAB: Touched an ATH of 6705 DIVI'S LAB: Touched an ATH of 6705 after a Buy triggered .
6705 could be considered as a fresh new Resistance .
( Not a Buy / Sell Recommendation
Do your own due diligence ,Market is subject to risks, This is my own view and for learning only .)

Review and plan for 19th May 2025Nifty future and banknifty future analysis and intraday plan.
Quarterly results.
This video is for information/education purpose only. you are 100% responsible for any actions you take by reading/viewing this post.
please consult your financial advisor before taking any action.
----Vinaykumar hiremath, CMT

DIVI'S LAB : Daily time frame ,in a Buy trajectory
DIVI'S LAB : Daily time frame ,in a Buy trajectory
Resistance: 6310
I 've already posted monthly time frame chart for DIVI's Lab which shows it in a Buy trajectory for quite some time and resistance level of 6310.
( Not a Buy / Sell Recommendation
Do your own due diligence ,Market is subject to risks, This is my own view and for learning only .)

DIVIS LAB : In a buy trajectory, resistance at 6310DIVIS LAB : In a buy trajectory, resistance at 6310
It's in a Buy trajectory on a monthly time frame as well
( Not a Buy / Sell Recommendation
Do your own due diligence ,Market is subject to risks, This is my own view and for learning only .)

Shorted DIVISLABDIVISLAB rallied last week and there was a major sell off almost immediately.
Now there is overall weakness with new LH formation.
The stock is pretty overbought which I feel makes it a good candidate for a reversal trade.
Hence, I've shorted it for a Target of 5800 price.
SL - Bullish closing above 6140
P.S. Not a recommendation. Pls do your own due diligence.

DIVISLAB: Impulse formationStock is rising in an impulsive manner and currently started it's 5th wave which shall take the prices towards 7000/7600 zone in the coming weeks. On the downside key level is 5400. One should remain bullish as long as prices are trading above this level.

Divislab is in bullish zoneMy custom indicators named Jadugar and Paka Kam generated signal at 6070 Becho means to sell at 6070 and it started falling from that level. Lets see how much it will fall.
Note: This is not a buy/sell call, trade at your own will. use stop loss too.

DIVISLAB | Strong Volume Breakout from Multi-Month Resistance 📈 Trade Recommendation:
✅ For Intraday:
Buy Above: ₹6,250 (on sustained breakout and volume)
Intraday Target: ₹6,350–₹6,420
Stoploss: ₹6,180 (below breakout zone)
📊 For Short-Term (1–2 weeks):
Buy on Retest: ₹6,200–₹6,250 (ideal risk-reward)
Target 1: ₹6,500
Target 2: ₹6,750
Stoploss: ₹6,050 (below retest support)
🔍 Technical Highlights:
Volume surge confirms breakout strength
RSI breakout above 70 indicates strong bullish momentum
Past resistance zone now acting as support on retest

DIVISLAB: Eyeing Breakout from A-B-C ChannelDaily TF
DIVISLAB is nearing the completion of a complex W-X-Y corrective pattern. A long position could be considered after a breakout from the A-B-C channel, with potential targets in the 6100–6400 range.
I will update more information soon.

DIVIS LAB | LONG REVERSAL | BTSTDIVIS LAB is showing a positive reversal price action from an area of strong support.
This support zone has been formed from Oct 2024.
Those looking to trade BTST can enter long for a Target to Daily R2 level which is around 5681 price.

DIVISLAB KEY LEVELS FOR 24/01/2025**Explanation:**
This trading system helps you avoid blind trades by providing confirmation for better entries and exits.
**Entry/Exit Points:**
- **Entry/Exit Lines:** Use the BLACK line for long trades and the RED line for short trades, based on confirmation from your trading plan.
- **Stop Loss:** For long trades, set the stop loss at the RED line below. For short trades, set it at the BLACK line above.
- **Take Profit:** For long trades, target the next RED line above. For short trades, target the next BLACK line below.
**Timeframe:**
Use a 5 timeframe for trading.
**Risk Disclaimer:**
This setup is for educational purposes. I'm not responsible for your gains or losses. Check the chart for more details.

DIVISLAB Key levels for 21/01/2025**Explanation:**
This trading system helps you avoid blind trades by providing confirmation for better entries and exits.
**Entry/Exit Points:**
- **Entry/Exit Lines:** Use the BLACK line for long trades and the RED line for short trades, based on confirmation from your trading plan.
- **Stop Loss:** For long trades, set the stop loss at the RED line below. For short trades, set it at the BLACK line above.
- **Take Profit:** For long trades, target the next RED line above. For short trades, target the next BLACK line below.
**Timeframe:**
Use a 5 timeframe for trading.
**Risk Disclaimer:**
This setup is for educational purposes. I'm not responsible for your gains or losses. Check the chart for more details.

Breakout Possibility in DIVISLABINVESTMENT OPPORTUNITY
Gap filling has been completed in DIVISLAB. There are high chances of it to breakout of the current downtrend.. Once 3320 Level is broken in daily chart and sustain then We Sharp Upmove is expected.
CMP 3214
Entry above 3320
Tgt1 3900, Tgt2 4500, Tgt3 5400
Timeline 1-2 Years
Disclaimer:
All the views are for educational purpose only. Use your own understanding before making any investment.

Bullish View Analysis for Divi’s LaboratoriesBullish View Analysis for Divi’s Laboratories:
1. Trigger Level:
A breakout above ₹5,950 will act as the signal for a bullish entry.
This level aligns with the 20 EMA, suggesting that buyers are regaining momentum.
2. Reasoning:
The price is currently in a consolidation phase within a range.
A breakout above ₹5,950 would indicate buyers are overcoming resistance, potentially driving the price towards higher levels.
3. Stop Loss:
Place your stop loss below ₹5,880 to manage risk.
This ensures that if the breakout fails, your losses are minimal.
4. Targets:
Target 1: ₹6,050 (the first resistance zone).
Target 2: ₹6,200 (the upper end of the range).
5. Supporting Indicators:
RSI (Relative Strength Index): Currently near 54, suggesting momentum is picking up but not yet overbought. A move above 60 would confirm bullish strength.
Volume: Look for an increase in volume during the breakout to validate the buying pressure.
6. Key Levels to Watch:
₹5,950: Breakout level.
₹5,880: Support zone for stop loss.
₹6,050 and ₹6,200: Profit booking zones.
Pro Tip:
Wait for a 4H or daily candle close above ₹5,950 before entering to avoid false breakouts.
Confirm with increasing volume and RSI moving higher for added confidence in the bullish move.
