DIVISLABDIVISLAB for short term and long term blue chip stock or take swing trade on this when break to the target 4000
DIVISLAB trade ideas


Short Term Cash Buy DIVISLAB @3820-3840 SL 3756 TGT 3965TK cross over at 3772.
MACD cross over 3770.
Moving averages and oscillators 14/14 indicates BUY signals.
Break R1 3759 next resistance 3959/4446.
30 min chart and daily chart is positive and hourly chart also improving.
Pharma is hot pick again due to second COVID-19 waves. Most of the pharma are on the BUY side CIPLA, Dr Reddy, STAR, and others.


Divislab Good For Positional Trade sustain above 3570-3580Divislab Good For Positional Trade
If sustain above 3570-3580 on closing basis then can give good move in upside Near to Target 3900

buy DivislabDivislab has retest its previous breakout levels. we may see further rise till 3800-3900 till it holds 3545


Divis LabDivis lab after taking support has moved up. It has also broken trendline and retested it. It is ready to move up with a decisive move in coming future.
Take advice from your financial advisor before taking trade. This is just for educational purpose.


divislab on 1 day support may reverse wait for higher highDVISLAB 1 DAY ANALYSIS SWING TRADE NOT FOR INTRA

"NSE:DIVISLAB" - "SELL" signal 15 min Chart (Solved Signal 1)-SELL signal generated by "Solved Signal 1(SS1)" in 15 min Chart of "NSE:DIVISLAB".
-"NSE:DIVISLAB" 15 min Chart
- Indicator used "Solved Signal 1(SS1)"
-Solved Signal 1 generates SELL signal(by default: text:- SS1, color= red,shape=triangledown)
on 15 min Chart of "NSE:DIVISLAB" .It means "NSE:DIVISLAB" can go down.
-Solved Signal 1 uses "NSE:DIVISLAB" Price data for Solving the Market(See description of Indicator).
-Like and Comment . NSE:DIVISLAB NSE:NIFTY BSE:SENSEX


DivisLab Ready to Retest Nice Price action on Daily and Weekly, looks like ready to retest the green zone as shown in my analysis. No position YET.


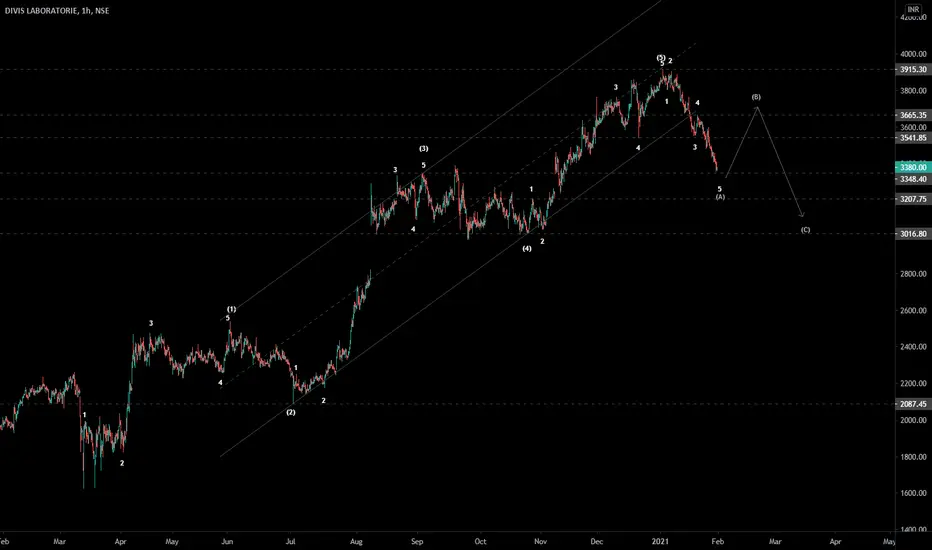
DIVISlab - Elliott wave analysis - ABC zigzag - buy & sell It is within correction mode and expected to go higher in B wave after impulse up completed. The B wave can be buy set up once the A wave finished. There is a high odd C wave short sell set up, which will be good swing trade to short sell once the B wave finished around 50-62 % of wave A.
Divis LabThere may be a downward channel, but I find the falling wedge better pattern.
Though it is trading below a support level one may go long with at least Rs. 20 sl which is not be put in the system but maintained by human

Divis lab - Bullish RSI Divergence on hourly chartRSI Divergence on hourly chart... Probability of Bounce here towards 3665 is high
Stoch RSI also turning up.
Pretty good risk reward trade if market behaves. I am taking it personally.
Strict stop loss of 3440.


