DIVISLAB trade ideas

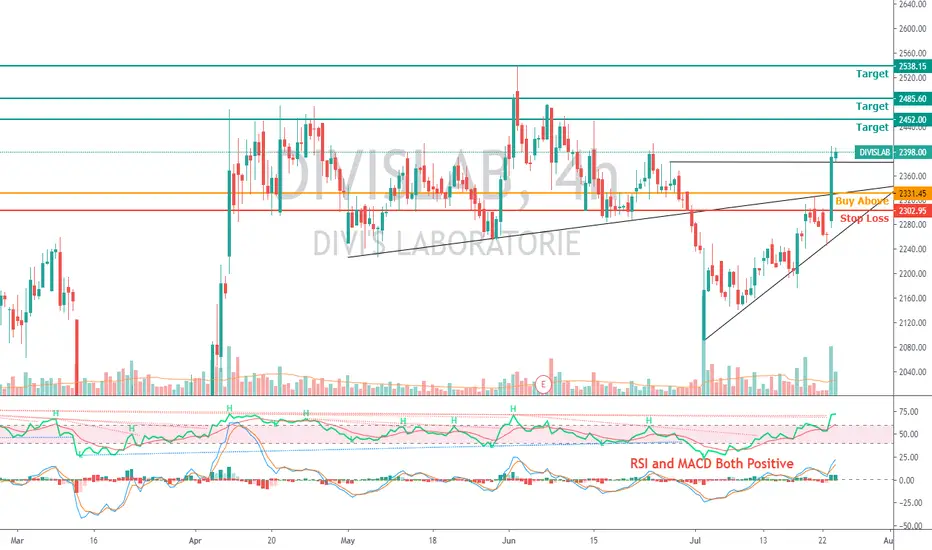
Divislab - 2600?DIvislab broken reistance with huge volume and looking to make new high... May test 2600... RSI and MACD are bullish and also seems a triangle breakout. Tragets on chart.


DIVIS SHORT DIVISLAB looks weak to me
entered short @ 2224
sl 2255
tgt 2098 and can even go down from there too..
trading is highly risky business
above trades are no tips , they are my observation
any trade taken will be your own risk
i am not responsible for any profit or loss
If you looking to trade with such confidence get in touch .


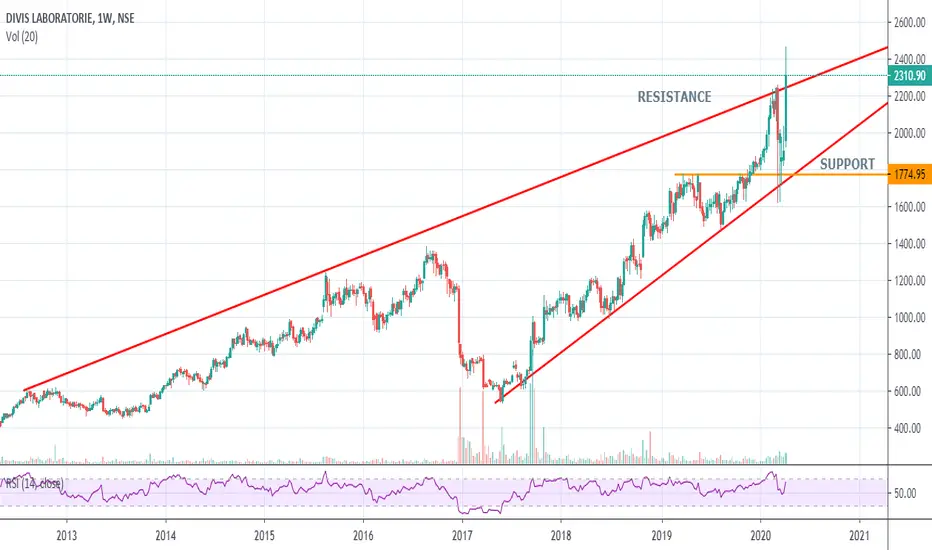
DIVISLABA channel is the area between two parallel trendlines – upper trendline (resistance line), and, the lower trend line (support line).
What is a trendline? It’s a line drawn over pivot highs or under pivot lows to show the prevailing direction of price.
Upper trendline (resistance line) is drawn by connecting price highs, and, the lower trendline (support line) is drawn by connecting price lows.

DIVISLAB TECHNICAL ANALYSISDIVIS LAB TECHNICAL ANALYSIS
THIS TIME PRICE IS WORKING IN FLAG RANGE...SHOULD BREAK IN UPSIDE.

Trading Idea : Buy Divi's Laboratories Ltd.Stock is making higher top and higher bottom on daily chart. Stock has took support at 21 Day EMA and showing reversal from support. ADX is also giving positive cross over.
We are recommending Buy around 2330-2340 with Stop Loss of 2250 (Closing Basis) for Target of 2470 in next 8-10 Days.

divislab Buy@ 2300, S.L@ 2273, Target@ 2385I am not sebi registered if you want to learn and educate yourself follow me otherwise no need..
above call is good to trade think and take your own decision..


DIVISLABPHARMA SECTOR LAST FEW DAYS UP 1 WAY.
WE SEEN PAUSE IN THIS SCENARIO, SOME PROFIT BOOKING EXPECTED .
BUT DONT THINK I TOLD YOU SELL, WAIT FOR RIGHT ENTRY AND ADD FOR GOOD RETURN.
BUT SOME DOWN SIDE POSSIBLE RISKY TRADE TAKE ENTRY WITH SL.
Divis lab - Bull trend continue? Divis Labs
Price moves above 2175 with OPEN=LOW candle which is sure sign of bullish ,Price may come back for retesting trend line before big move which will go 2240,2320 and 2360.
If price unable to sustain above the 2160 base price level it may fall back to 2120 and 2060 levels .
Please wait for the price action and trade accordingly .
This video is for educational purpose only.
