Divis lab... Inverse head and shoulder pattern in weekly chartDivis lab... Inverse head and shoulder pattern in weekly chart
DIVISLAB trade ideas

Divis Laboratories Ltd
LONGTERM PORTFOLIO STOCK
TARGETS IN CHART
SL AS PER YOUR APETITE
FUNDAMENTALS
Market Cap
₹ 1,01,065 Cr.
Current Price
₹ 3,807
52 W High / Low
₹ 3,949 / 2,730
Stock P/E
75.8
Book Value
₹ 478
Dividend Yield
0.80 %
ROCE
19.4 %
ROE
14.9 %
Face Value
₹ 2.00
Promoter holding
51.9 %
EPS last year
₹ 68.7
EPS latest quarter
₹ 13.1
Debt
₹ 5.00 Cr.
Pledged percentage
0.00 %
Net CF
₹ -1,045 Cr.
Price to Cash Flow
41.1
Free Cash Flow
₹ 1,987 Cr.
Debt to equity
0.00
OPM last year
30.5 %
OPM 5Year
37.7 %
Reserves
₹ 12,624 Cr.
Price to book value
8.00
Int Coverage
1,649
PEG Ratio
4.84
Price to Sales
13.8
Sales growth 3Years
12.9 %
Profit Var 3Yrs
11.0 %

DIVISLAB - Make or break levelDIVISLAB Make or break level
Current make or break level for Investors is 3752
for new entry buy above 3850.
Safe Stop loss around 3655.
Please do your due diligence before trading or investment.
Disclaimer -
I AM NOT A SEBI REGISTERED ANALYST OR ADVISOR. I DOES NOT REPRESENT OR ENDORSE THE ACCURACY OR RELIABILITY OF ANY INFORMATION, CONVERSATION, OR CONTENT. STOCK TRADING IS INHERENTLY RISKY AND THE USERS AGREE TO ASSUME COMPLETE AND FULL RESPONSIBILITY FOR THE OUTCOMES OF ALL TRADING DECISIONS THAT THEY MAKE, INCLUDING BUT NOT LIMITED TO LOSS OF CAPITAL. NONE OF THESE COMMUNICATIONS SHOULD BE CONSTRUED AS AN OFFER TO BUY OR SELL SECURITIES, NOR ADVICE TO DO SO. THE USERS UNDERSTANDS AND ACKNOWLEDGES THAT THERE IS A VERY HIGH RISK INVOLVED IN TRADING SECURITIES. BY USING THIS INFORMATION, THE USER AGREES THAT USE OF THIS INFORMATION IS ENTIRELY AT THEIR OWN RISK.
Thank you.

Divis lab near brekaoutHello All,
I am glad you have liked my post and I am sure everyone who have traded on these post would have made profits.
If you like my Idea, Don't forget to Boost and comment on my Analysis.. The recommendations are purely for educational purpose only, consult you financial advisor before trading.
Gautam Khanna
Technical Analyst by Passion :-)

#DIVISLAB udne ko taiyaar? rounding/cup & handle pattern seenDivis lab on daily time frame has made a rounding bottom or cup n handle pattern. Also it has closed above trend line resistance of 3712. Once it manages to sustain above 3813 then it can try to touch 3974/4120/4331/4527. Once 4100 is crossed I will bring my trail sl either at cost or at 3974 to avoid any loss in this trade. Let's see if Divis listens to my analsis or not.
Thanks for reading.
Happy trading & investing.
PS : I am not SEBI registered IA so please consult your financial advisor before taking any trade mentioned by me.


msftdivis technology chart pattern
here i have creatted the best possible chart pattern and the price prediction with all scenarios

DIVI'S LABORATORY DESCENDING WEDGE BREAKOUT - BULLISH
DESENDING WEDGE BREAKOUT -
Divi's laboratory has recently broken out of a Descending Wedge pattern with confirmation on weekly chart indicating strong upside pressure
50D & 200D SMA ACTING AS STRONG SUPPORT -
Price has recently reversed from these 2 sma on weekly chart simultaneously indicating strong upward momentum
REVERSAL FROM STRONG SUPPORT-RESISTANCE ZONE -
Price has reversed from one such zone a few months back after a long consolidation indicating upside pressure
ENTRY & EXIT LEVELS -
TAKE PROFIT (TP) - 4318
STOP LOSS - 2711

Divis Lab updateDivis Lab Elliott Wave Count
this is an update to our previous post!
Based on the current market situation, it appears that Divis Laboratories is still experiencing the 3rd wave. As a result, we can anticipate a new low within the 3200 range, followed by a rebound. This view is consistent with our previous post, with only minor adjustments to the inside counts to reflect the current market trends.
Please exercise caution when trading as this information is for educational purposes only.
NSE:DIVISLAB BSE:DIVISLAB NSE:DIVISLAB1!

DIVISLAB - Elliott Wave CountDIVISLAB - Elliott Wave Count
It appears that Divislab is in wave C and to reach to or below 3400 in the coming days. Then we can see a good impulse wave towards 4000 and beyond. Please note that we have placed our stop loss at the level of 3250. This means that if the price drops below this point, we will exit the long position.
Please note that this information is for educational purposes only, and it is crucial to trade with caution.
NSE:DIVISLAB NSE:DIVISLAB1! BSE:DIVISLAB

divislab long NSE:DIVISLAB after the breakout of head and shoulder pattern. and the stop loss sould is below the right shoulder and long after the neakline is broken and candle should close below the neakline .

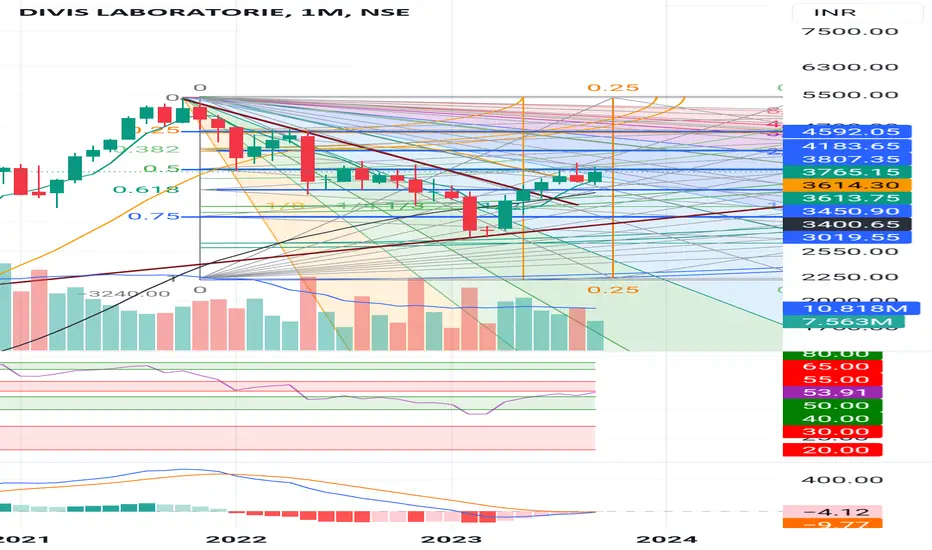
DivisDivis is indicating a reversal, with the monthly candle successfully retesting the 1/1 Fann angle and closing above the 1/1 Resistance level.
A conservative entry point is above 3807, but a more aggressive trader may consider entering at the current level, especially given the strength shown by other indicators such as MACD and RSI.
The stop-loss can be set at either the low of the previous week's candle or the weekly 5-period Moving Average (MA).
Bullish trend in DivislabDivislab is in bulliish trend. Stock has taken support of 50 EMA on daily chart. Buy Divislab for uptrend in short term.

$DIVISLAB 7R short ideaNSE:DIVISLAB just gave up its 50 DMA.
a short entry is possible on retest of the 50 DMA and take it way down to the valid OB near the 200 DMA. the RR is 7 so worth a try.
Let me know what you think.

DIVISLAB--Near to its Resistance zone??Showing strong bullish pressure...
this may be the end of bullishness or initiation of large quantity on buy side...
keep on buy side until the resistance zone...
if breaks will get more points.

DIVISLAB DIVISLAB is also making an falling wedge pattern on weekly time frame and giving a healthy breakout
i have analysed it early but late to post

DIVISLAB DAILY CHARTDIVISLAB DAILY CHART
Technicals unfolded as the stock has broken out of its falling channel


DIVISLAB Analysistrendline is broken and retested price is moving up....
now price exactly at its previous supply zone....
we have to look if its break or not....
we have a strong support in the range as demand zone...
In daily time frame still not at reached the supply zone...but in weekly it reached...
we have a trendline support as well in daily time frame...please be on the buyside...
if suddenly price falls below the trendline also don't go for sell, small demand will again push it upside...

DIVIS LABDivis lab looking gud for long term investment on monthly time frame. there may gud movement in the near future. Sl will be 2800 tgt will be 4600.

DIVIS LabIt has come out of good consolidation range and now good upside is possible. One may look for entry with SL of 20 WMA.

DIVIS Lab after long time looking bullish for positional Divis after long time looking good for positional setup for coming days.
