DIXON TECHNOLOGIES LEVELSHi, Here i am sharing you upcoming support and resistance of NSE:DIXON .
This is my personal analysis, only to learn stock market behavior. Thanks.
DIXON trade ideas

DixonThese are swing ideas which you can add your watchlist and analysis for yourself !
Keep on your radar!
This content only education purpose!
❗I am not sebi ragister❗


Dixon Tech is near BreakoutDixon Technologies is near Breakout with a good volume,
has made support and Resistance trendline
Buy Above 5630 and 1st target is 6000

Target 8405 based on fibonacciBased on trendlines I have drawn few trendlines, Now
1) Stock movement will be within range of 5000 and 5500,
2) breakout may occur after 5450
3) consolidation at 5900-6000
4) Again big breakout may occur at 6000
5) Note: HH and HL are must in process.


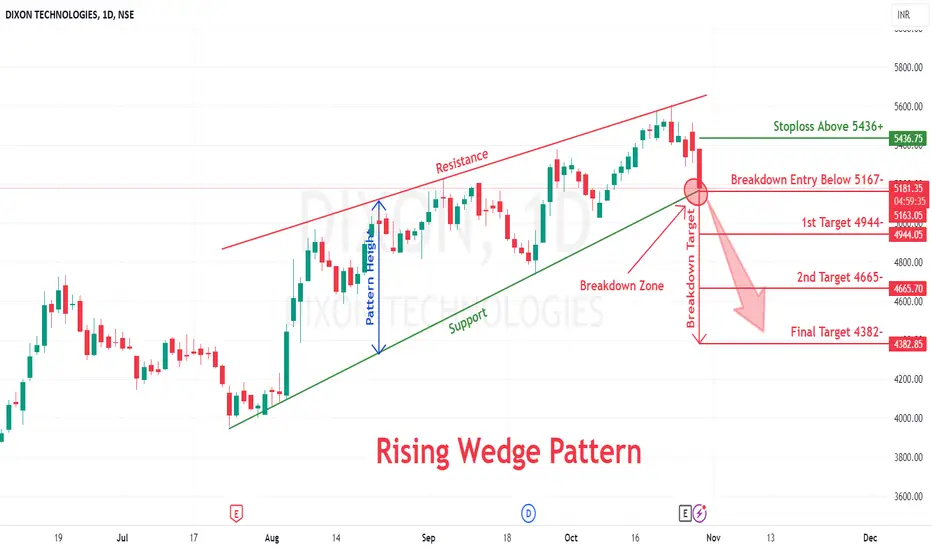
Rising Wedge breakdown in DIXONDIXON TECHNOLOGIES LTD
Key highlights: 💡⚡
✅On 1Day Time Frame Stock Showing Breakdown of Rising Wedge Pattern .
✅ Strong bearish Candlestick Form on this timeframe.
✅It can give movement up to the Breakdown target of 4382-.
✅Can Go short in this stock by placing a stop loss above 5436+.
💥Dixon Technology💥- Nice Breakout💥Dixon Technology💥- Nice Breakout
Capital to be deployed- 20k
Investing Price -5240-60
Breakout Price -5220
Stoploss-4562
Targets-6841-7469
RT for max reach.
#dixon #StocksToBuy #stocks #StocksToTrade #StocksInFocus #stockstowatch #StocksInNews

Swing Trading Opportunity in Dixon TechnologiesRefer the chart for Entry,Target and SL.
NOTE: This trade is only for Equity Swing buy and not to be considered for options trading.
Please do follow Position Sizing and Risk Reward Ratio while planning any trades.
Note: This information is for education purpose only and please do your own research and consult your financial advisor prior to taking any action.
TO CONNECT WITH ME CHECK OUT MY BIO.
If you like this Idea, Please do like my ideas and share it with your friends. check my bio.
Please boost my ideas and send cheers as it acts as a motivation to keep posting my analysis.
Thank you

DIXON TechnologiesDIXON Technologies:
Looking like a rocket now-a-days. The behavior of the stock is wave 3 behavior.
Go through the chart you will some good meterial of #kennedy's #Channels and #elliott #waves.

Dixon Technology Reverse Dixon technology reverse from support point
Buy Above 4150
Sl 3920
Target 4680, 5020

Going towards 5kMinimum downside..volume increasing
Target 6k
Stop-loss would be 4600
Exactly 4600 levels stock bounced up.
Risk reward..1:2

DIXON: the rally is ONperfect BO, formation of Cup and Handle. Pretty volume in 3 to 4 day, the counter looks in a hurry to reach 5600 its first target, 2nd Target it ATH, this may happen with some breaks in between.


Dixon Technologies. Look to go shortAs per the weekly chart we are in a perfect place to begin the downward trend. we have take out the weekly buy stops, now waiting for the heavy displacement in the stock price for the downside and move towards Rs2500 per share.

Dixon Technologiesa weekly flag and pole patter with a clear breakout and retest and again at the good levels.
If you know about this pattern you can see it clearly and short as well as long trade can be seen in future according to ones capacity.

DIXON TECHNOLOGY Elliott Wave AnalysisDIXON TECHNOLOGY
Dixon Technology Impulsive Movement: Dixon Technology has started an "impulsive movement upside," indicating that the stock's price has been rising in a strong and decisive manner.
Bottoming Out Near 2553: The stock reached a low point near 2553 on January 30, 2023. This low is referred to as the "bottoming out" point.
Intermediate Wave (2) : The low at 2553 is labeled as an "intermediate wave (2)," which suggests that it is part of a larger wave pattern. In Elliott Wave Theory, waves are labeled numerically and represent different degrees of price movement.
Leading Diagonal and Completed Waves: The stock's upward movement from the low at 2553 is described as starting with a leading diagonal in the internal wave 1. This is a specific pattern in Elliott Wave Theory. The stock has completed waves (i), (ii), (iii), and (iv), and is currently in the process of forming the (v) wave.
5th Wave: The analysis suggests that the stock is currently in the 5th wave, which is expected to consist of sub-waves labeled i, ii, iii, iv, and v. It is observed that waves i, ii, and iii of the (v) wave have already been completed.
Future Movement: Stock will continue its upward movement and complete waves iv and v of the 5th wave. It suggests that the target price for the stock's upward movement is 5138. However, before reaching this target, the stock may retrace back down to around 4504.
Disclaimer: The information provided is based on the interpretation of Elliott Wave Theory as described in the text. This analysis is for informational and educational purposes only and should not be considered as financial advice or a recommendation to buy, sell, or invest in any financial instrument, including stocks or securities. Market movements are influenced by a complex interplay of factors, and predictions based on technical analysis may not always accurately forecast future price movements. Trading and investing in financial markets carry risks, and it's important to conduct thorough research, consult with qualified financial professionals, and consider your own risk tolerance and investment goals before making any trading or investment decisions. The author and OpenAI do not assume any responsibility for financial decisions made based on the information provided in this response.

Dixon breakout with volume. Dixon has given a major breakout.
It has broken out of Flag and Pole pattern with good volume.
It has also formed a bullish divergence by forming Lower Low on price and Higher Low on indicator.
Entry: CMP
Exit/Stoploss: 4080
T1: 4700
T2: 5000
T3: 5600
T4: 5930

Dixon Technologies Ltd.*Dixon Technologies Ltd.*
P&F Formation on Yearly Basis.
Price BreakOut Sustained.
Strong Vol. Consolidation/ Continued BuiltUp.
Electronics Manufacturing PLI / Sector outlook Positive for Company.
Trail SL with Upside.
Book Profit as per Risk Appetite.
Do Your Own Research as well. This is an Opinion
Happy Investing 😇

DIXON - Bullish Swing ReversalNSE: DIXON is closing with a bullish swing reversal candle supported with volumes.
Today's volumes and candlestick formation indicates strong demand and stock should move to previous swing highs in the coming days.
The stock has been moving along the horizontal support for the past few days which is indicating demand.
One can look for a 8% to 12% gain on deployed capital in this swing trade.
The view is to be discarded in the event of the stock breaking previous swing low.
#NSEindia #Trading #StockMarketindia #Tradingview #SwingTrade

Bullish flag pattern breakout in Dixon TechDIXON TECHNOLOGIES LTD
Key highlights: 💡⚡
✅On 1 Day Time Frame Stock Showing Breakout of Bullish flag Pattern .
✅ Strong Bullish Candlestick Form on this timeframe.
✅It can give movement up to the Breakout target of 6076+.
✅Can Go short in this stock by placing a stop loss below 3730-.

very crucial Stage for downsite and upside support very cruiceal support 4000 if break heavy volume most of chance is going very sharp correction but my view is support not break let see and 4000 is psychological support but one time ttrend reverse

Dixon - good shorting canditate RR - 1:3:6Good shorting candidate - with SL of 3% one can target 10% and 17%.
Define your risk in advance and strictly follow SL.
PS : Only for learning purpose.
Pls consult your financial advisor before entering any trade.
