DLF Long_Support @ 20 DEMADLF Long:
- Price support @ 20 DEMA
- Bullish Engulfing candle.
- Enter long when the price is favorable in the lower timeframe
- SL: Close below 20 DEMA
DLF trade ideas


DLF - Towards 580 - Triple top BreakdownDLF has shown Triple top breakdown and with this it will have following targets
Target1: 655
Target2: 580

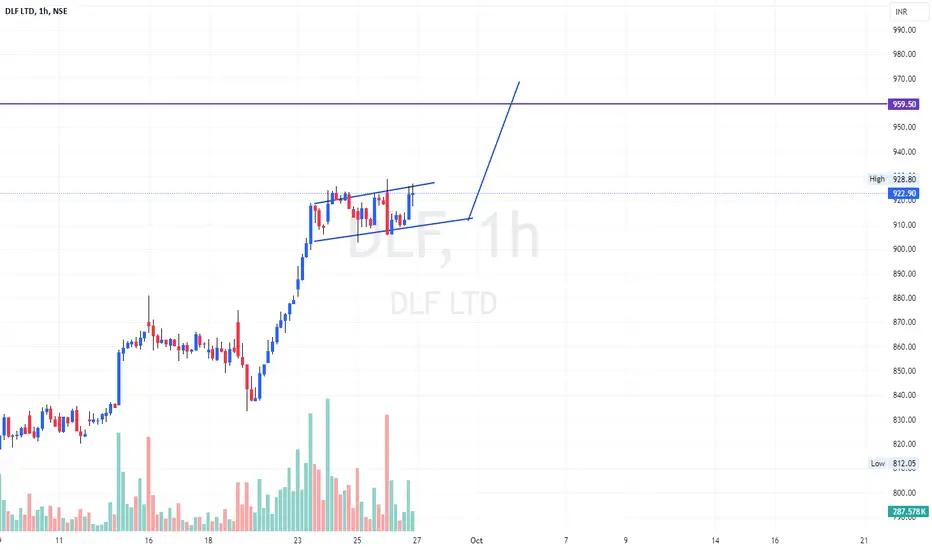
DLF change as uptrend ?? what is it target?asper my analysis dlf change as a uptrend it breaks the supply and change as uptrend. final target 960 after retracement at 700

DLF - LONGNSE:DLF Year with effect of Mars and in numerology also 2025 is the year for Mars- reflect the good momentum in realty sector. Also weekly chart showing buyers at location.

DLF BUILDING ABOVE CHANNEL RANGE DLF Limited is one of India's leading real estate development companies, founded in 1946 by Chaudhary Raghvendra Singh. It is headquartered in New Delhi and has developed residential, commercial, and retail properties across Delhi, Gurgaon, Haryana, and other regions.
Key Highlights:
- Industry: Real Estate
- Market Presence: Offices, apartments, shopping malls, hotels, and golf courses
- Major Projects: DLF Cyber City, DLF Mall of India, DLF Emporio, and various residential townships
- Revenue (2024): ₹6,958 crore (US$820 million)
- Net Income (2024): ₹2,724 crore (US$320 million)
Support & Resistance Levels
- Support: 670 INR
- Resistance: 695 INR (Potential breakout level)
- Next Target Levels: 740 INR and 800 INR (If breakout above 695 INR occurs)
Market Sentiment
- Overall Trend: Bullish
- Short-Term Outlook: Positive momentum with potential breakout
Short-Term Target Levels
- Immediate Resistance: 695 INR (Breakout level)
- Next Target: 740 INR (If breakout above 695 INR occurs)
- Higher Target: 800 INR (If momentum sustains)
- Support Levels: 670 INR (Key support zone)

DLF Ltd view for Intraday 15th May #DLF DLF Ltd view for Intraday 15th May #DLF
Resistance 690 Watching above 693 for upside momentum.
Support area 680 Below 680 ignoring upside momentum for intraday
Watching below 678 for downside movement...
Above 690 ignoring downside move for intraday
Charts for Educational purposes only.
Please follow strict stop loss and risk reward if you follow the level.
Thanks,
V Trade Point

DLF | Pattern: Bullish RSI DivergenceA clear bullish divergence is visible between price and RSI on the weekly chart:
Price made a lower low
RSI made a higher low (marked with arrows)
This is a strong reversal signal, indicating potential trend change to the upside.
📈 Trade Setup:
Entry: ₹687 (CMP)
1st Target: ₹832.70
2nd Target: ₹941.90
Stop Loss: Below recent swing low
Risk-Reward is favorable, and volume support is visible. RSI has also broken above the 45 level, suggesting strengthening momentum.

Elliott Wave Analysis of DLF: A Technical PerspectiveHello friends, let's analyze the DLF chart on a daily time frame. Currently, we're observing a corrective phase, where the stock has completed a flat correction pattern (A-B-C) with a 3-3-5 structure. Following this correction, we've seen a significant drop, accompanied by a strong double divergence in the RSI indicator. Where Fibonacci Retracement of last long Rally on Weekly is near 50% - 55% which is less than 61.8% should consider as a Healthy Retracement
As the price is currently moving upwards, completing wave counts, a breakout above the downward trend line would increase our conviction in the analysis.
This analysis is for educational purposes only and not a tip or advisory. If the price breaks out and stays above the trend line while maintaining the low of 601, we can expect further upside momentum. However, 601 would remain a crucial invalidation level, and a breakdown below it would require us to reassess our wave counts.
Key points:
1. DLF chart analysis on daily time frame
2. Flat correction pattern (A-B-C) with 3-3-5 structure
3. Healthy Retracement
4. Strong double divergence in RSI indicator
5. Breakout above trend line increases conviction (Which is pending yet)
6. 601 as invalidation level
Please note that this is a Educational technical analysis post and not a recommendation to buy or sell.
I am not Sebi registered analyst.
My studies are for educational purpose only.
Please Consult your financial advisor before trading or investing.
I am not responsible for any kinds of your profits and your losses.
Most investors treat trading as a hobby because they have a full-time job doing something else.
However, If you treat trading like a business, it will pay you like a business.
If you treat like a hobby, hobbies don't pay, they cost you...!
Hope this post is helpful to community
Thanks
RK💕
Disclaimer and Risk Warning.
The analysis and discussion provided on in.tradingview.com is intended for educational purposes only and should not be relied upon for trading decisions. RK_Charts is not an investment adviser and the information provided here should not be taken as professional investment advice. Before buying or selling any investments, securities, or precious metals, it is recommended that you conduct your own due diligence. RK_Charts does not share in your profits and will not take responsibility for any losses you may incur. So Please Consult your financial advisor before trading or investing.

DLF 623- Good to BuyDLF 623 is a good to buy for Target 710.
Technically it is at Phase D of accumulation and the recent news adds value to the study
Positive sentiment from the Trumph's tariff pause and 25 bps cut in RBI's interest rates are likely to influence the realty stocks.
DLF
Godrej Properties
Sobha Realty

DLF - Smooth Ride AheadBeen studying the charts over the past few weeks, it went into a fall past weeks. Guess time for recovery now...

DLF Swing Trade Hello,
Trend-Based Analysis. Buy the Dips, Sell The Rallies, Also Following the Trend. Let's see where the Price Action takes us, Riding the wave. Potential trade setups based on trend momentum.
Technical analysis based on trend identification and momentum, Looking for high-probability setups within the prevailing trend.
Analyzing the current market trend and potential future price movement. Focusing on risk management and reward-to-risk ratios.
Details is Mentioned in Chart, Read carefully.. .

NSE:DLF 🏢 On Verge of Multi year breakout ??⁉️NSE:DLF
DLF Ltd., incorporated in the year 1963, is a Large Cap company (having a market cap of Rs 101,735.31 Crore) operating in Real Estate sector.
DLF Ltd. key Products/Revenue Segments include Property Development, Rental Income, Other Operating Revenue and Royalty Income for the year ending 31-Mar-2022.
For the quarter ended 30-06-2022, the company has reported a Consolidated Total Income of Rs 1,516.28 Crore, down 8.22 % from last quarter Total Income of Rs 1,652.13 Crore and up 22.06 % from last year same quarter Total Income of Rs 1,242.27 Crore. Company has reported net profit after tax of Rs 258.15 Crore in latest quarter.

SWING IDEA - DLFDLF , a major player in the real estate sector, is showing promising technical signals for a swing trade.
Reasons are listed below :
Break of Flag and Pole Pattern : The stock has broken out of a flag and pole pattern, a continuation pattern indicating the potential for further upside in the ongoing trend.
800 Zone as a Strong Support : The 800 level has proven to be a solid support zone. The price is currently bouncing back from this level, suggesting that buyers are stepping in to support the price.
Bullish Engulfing Candle on Weekly Timeframe : The formation of a bullish engulfing candle on the weekly chart indicates strong buying pressure, which often leads to a continuation of the upward trend.
Trading Above 50 and 200 EMA : DLF is trading above both the 50-day and 200-day exponential moving averages, reinforcing the bullish sentiment and indicating strong support at these levels.
Intact Uptrend : The overall trend remains intact, suggesting that the stock is in a strong upward trajectory with the potential for further gains.
Target - 967 // 1030
Stoploss - weekly close below 795
DISCLAIMER -
Decisions to buy, sell, hold or trade in securities, commodities and other investments involve risk and are best made based on the advice of qualified financial professionals. Any trading in securities or other investments involves a risk of substantial losses. The practice of "Day Trading" involves particularly high risks and can cause you to lose substantial sums of money. Before undertaking any trading program, you should consult a qualified financial professional. Please consider carefully whether such trading is suitable for you in light of your financial condition and ability to bear financial risks. Under no circumstances shall we be liable for any loss or damage you or anyone else incurs as a result of any trading or investment activity that you or anyone else engages in based on any information or material you receive through TradingView or our services.
@visionary.growth.insights

Concept of IDM how IBM works in both the directionIn this video I have explained very nicely how IDM works in both the direction up and down in the picture you can see very clearly how it's sweeping the liquidity before continuing it's rally it's also a short kind of AMD concept can you see the idm happens at the place of manipulation and it returns

Concept of IDM how IBM works in both the directionIn this video I have explained very nicely how IDM works in both the direction up and down in the picture you can see very clearly how it's sweeping the liquidity before continuing it's rally it's also a short kind of AMD concept can you see the idm happens at the place of manipulation and it returns

DLF S/R Support and Resistance Levels:
Support Levels: These are price points (green line/shade) where a downward trend may be halted due to a concentration of buying interest. Imagine them as a safety net where buyers step in, preventing further decline.
Resistance Levels: Conversely, resistance levels (red line/shade) are where upward trends might stall due to increased selling interest. They act like a ceiling where sellers come in to push prices down.
Breakouts:
Bullish Breakout: When the price moves above resistance, it often indicates strong buying interest and the potential for a continued uptrend. Traders may view this as a signal to buy or hold.
Bearish Breakout: When the price falls below support, it can signal strong selling interest and the potential for a continued downtrend. Traders might see this as a cue to sell or avoid buying.
20 EMA (Exponential Moving Average):
Above 20 EMA(50 EMA): If the stock price is above the 20 EMA, it suggests a potential uptrend or bullish momentum.
Below 20 EMA: If the stock price is below the 20 EMA, it indicates a potential downtrend or bearish momentum.
Trendline: A trendline is a straight line drawn on a chart to represent the general direction of a data point set.
Uptrend Line: Drawn by connecting the lows in an upward trend. Indicates that the price is moving higher over time. Acts as a support level, where prices tend to bounce upward.
Downtrend Line: Drawn by connecting the highs in a downward trend. Indicates that the price is moving lower over time. It acts as a resistance level, where prices tend to drop.
RSI: RSI readings greater than the 70 level are overbought territory, and RSI readings lower than the 30 level are considered oversold territory.
Combining RSI with Support and Resistance:
Support Level: This is a price level where a stock tends to find buying interest, preventing it from falling further. If RSI is showing an oversold condition (below 30) and the price is near or at a strong support level, it could be a good buy signal.
Resistance Level: This is a price level where a stock tends to find selling interest, preventing it from rising further. If RSI is showing an overbought condition (above 70) and the price is near or at a strong resistance level, it could be a signal to sell or short the asset.
Disclaimer:
I am not a SEBI registered. The information provided here is for learning purposes only and should not be interpreted as financial advice. Consider the broader market context and consult with a qualified financial advisor before making investment decisions.

Key Support / Resistance Breakout - Swing TradeDisclaimer: I am not a Sebi registered adviser.
This Idea is publish purely for educational purpose only before investing in any stocks please take advise from your financial adviser.
Key Support & Resistance Breakout. Stock has give Breakout of Resistance level. Keep in watch list. Buy above the high. Suitable for Swing Trade. Stop loss & Target Shown on Chart.
Be Discipline because discipline is the Key to Success in the STOCK Market.
Trade What you see not what you Think.


DLF LONG SETUPStock is in uptrend with minor correction and sideways trend.
Volume is also above average. Price in upper time frames are also hovering above 50 EMA...
Time frame - Daily
Pattern - Triangle breakout with volume...

DLF- Bullish Swing- Very strong this time!! NSE:DLF
16.08.2024
Buy 870
Target 934
StopLoss 826
RiskReward- 1:1.5
1. Inside bar breakout in weekly & daily TF
2. After very good uptrend price is under consolidation from last 4 months.
Today very good breakout found with very good volumes
3. Found decreased volumes in last few sessions
4. Rejection from 200 EMA and price crossed above 21 & 50 EMA
5. RSI indicates bullish view
6. Price rejected from strong key level

DLF LTD Long term analysis
NSE:DLF read for strong rally as it has taken strong breakout of daily trendline as well as strong bounce of over an year of consolidated support zone.
Add more till 840 only with SL of 825.
Major targets are highlighted in Blue lines.
