D-link BullishD-Link bullish Momentum.
Channel breakout with good volume.
If sustains above 61% retracement on Fib levels then can go for New ATH.
DLINKINDIA trade ideas


DLINKINDIA - Technical Analysis Insight 🚀 DLINKINDIA - Technical Analysis Insight 🕵️
🔎 Buy Above: ₹635 📈
🔎 Sell Target: ₹874 💰
💡 Key Highlights:
📊 Breakout potential spotted within consolidation!
🔥 52-Week High: +15.69% momentum in sight!
📈 Strong Relative Strength Line indicating outperformance.
🔄 Keep an eye on 10WEMA for trend confirmation.
💼 Pro Tip: Always use proper risk management to secure gains.
Follow for more trading setups! 🎯
#TechnicalAnalysis #DLINKINDIA #TradingSignals #StockMarket

D-LINK INDIA LTD S/R Support and Resistance Levels: In technical analysis, support and resistance levels are significant price levels where buying or selling interest tends to be strong. They are identified based on previous price levels where the price has shown a tendency to reverse or find support.
Support levels are represented by the green line and green shade, indicating areas where buying interest may emerge to prevent further price decline.
Resistance levels are represented by the red line and red shade, indicating areas where selling pressure may arise to prevent further price increases. Traders often consider these levels as potential buying or selling opportunities.
Breakouts: Breakouts occur when the price convincingly moves above a resistance level (red shade) or below a support level (green shade). A bullish breakout above resistance suggests the potential for further price increases, while a bearish breakout below support suggests the potential for further price declines. Traders pay attention to these breakout signals as they may indicate the start of a new trend or significant price movement.
20 EMA: The yellow line denotes 20 EMA, to interpret the 20 EMA, you need to compare it with the prevailing stock price. If the stock price is below the 20 EMA, it signals a possible downtrend. But if the stock price is above the 20 EMA, it signals a possible uptrend.
Disclosure: I am not SEBI registered. The information provided here is for learning purposes only and should not be interpreted as financial advice. It is important to consult with a qualified financial advisor before making any investment decisions. Tweets neither advice nor endorsement.

DLINKINDIAwe are looking DLINKINDIA in bullish move.
Disclaimer:
Kind regards to all friends and members ,
Stock market investment is subject to 100% market risks. Our company is not a SEBI registered company. Please consult your financial advisor before investing. This is for learning and training purposes only. Market Traps administrators are not responsible for any financial gains or losses resulting from your decisions. You acknowledge that stock market investments are highly risky and that you understand the market risks involved. Hence any legal action is void.

DLINK INDIACMP 441
SL 412
TAGETS - 20-25%+
swing trade...formed a good base & after a shakeout ready to make new highs ...a very good chart to trade ,also confirmation with very high volumes .

D-LINKSeems its linking to climb the upward staircase soon
a very nice setup for mid term investments

DLINK INDIA STOCK ANALYSIS"D-Link India has recently shown a promising breakout candle, indicating a favorable area for accumulation Previously, D-Link India formed a triangle pattern, resulting in a significant 30% move. Currently, it's consolidating well from that point, presenting a great opportunity."

#DLINKINDIA is Near to Break Previous All Time High
Company has reduced debt.
Company is almost debt free.
Company has delivered good profit growth of 28.0% CAGR over last 5 years
Company has been maintaining a healthy dividend payout of 39.8%
Strengths:
Established market position and strong distribution network: D-Link is the market leader in switches and wireless local area network (WLAN) products, with a significant market share. In fiscal 2019, the company introduced a series of high-end products for its enterprise business, including unmanaged long-term power over ethernet (PoE)/PoE plus switches; new generation layer 3 stackable managed switches with advance hardware and software enhancements for better performance, flexibility and ease of management; and industrial grade switches. D-Link has invested in state-of-the-art support infrastructure for both consumers and enterprises, which includes 10 D-Link-owned service centres with more than 50 experts in tier 1 cities, over 23 partner service centres with more than 40 experts in tier 2 / tier 3 cities, partner collection points in more than 105 cities and logistical support in over 190 cities. D-Link Technical Support Centres (DTSC) are manned by over 30 highly skilled engineers providing L1 to L3 support for all retail and enterprise customers.
Healthy financial risk profile: Networth was Rs 363 crore as on March 31, 2023, and is expected to increase over the medium term because of steady accretion to reserves and absence of debt repayment. Return on capital employed improved to 36% in fiscal 2023 as profitability increased. In the absence of any debt-funded capex, the financial risk profile is expected to remain healthy over the medium term.
Weaknesses:
Exposure to intense competition and risks inherent in the networking industry: D-Link mainly operates in the home and small and medium enterprise segments of the networking industry, where profitability is lower than that in the institutional sales segment. The latter is dominated by Cisco India and other new entrants. Profitability in the retail segment is constrained by intense competition and commoditised products.
Susceptibility to volatility in input price and currency: Copper, the key input for manufacturing cables is an open market commodity traded globally on exchanges, leading to volatility in its prices. Furthermore, fluctuations in currency also impact profitability, as the company imports about 30% of its traded products. Complete and immediate passing on of cost increases is difficult given the competitive pressure. The company experiences lag of 45-60 days in passing on price hikes. Hence, the operating margin will remain susceptible to fluctuations in raw material prices and currency. D-Link hedges currency exposure up to 70% of the total exposure by entering forward contracts.
Liquidity: Adequate
Cash accrual, expected at Rs 65-75 crore in fiscals 2024 and 2025, will support liquidity in the absence of any capex or debt obligation. Unutilised bank limit of Rs 10 crore will be adequate to fund the company’s fixed expenses. Cash surplus is expected to remain healthy over the medium term.

DlinkStrong accumulation with volumes on Up days far higher than on low days
Breakout of downward sloping channel with huge volumes n Good bullish candlestick.

DLINK 1DTF"D-Link has demonstrated an average breakout following a period of consolidation, suggesting a favorable opportunity for accumulation as it continues its upward trajectory."
D Link India - GO LongD-Link (India) Ltd is primarily engaged in marketing and distribution of networking products. The company is a leader in the shipment of switches and wireless local area network products with a market share of 30% and 40% respectively.
Fundamentals
The company is in the small-cap range having ROCE and PE in double-digit which is a good indicator for a long-term investment
The Company is almost debt-free.
The company has delivered good profit growth of 51.3% CAGR over the last 5 years
The Company has been maintaining a healthy dividend payout of 30.1%
FII have increased its stake marginally
Technical
Price had made all-time high and has retraced back, chances of bouncing back to the same level can be considered

DlinkindiaThese are swing ideas which you can add your watchlist and analysis for yourself !
Keep on your radar!
This content only education purpose!
❗I am not sebi ragister❗

DLink Swing Trade IdeaDLink, looks strong in monthly and weekly, multiple times sellers have attempted to bring the price down at the major supply zone of 228-253, but buyers have won and the stock is moving up.
Weekly is moving in a narrow range consolidation, 3rd week, now, post the triangle compression breakout that happened.
One may look for consolidaiton BO in the upper side of the channel in 75 mins and any Lower TF for a better entry.
Monthly RSI is perfectly moving from over sold to overbought, yet to reach overbought.

Dlink has given a strong breakout!As seen in the chart, Dlink has formed a flag and pole which was broken 2 days back.
The flag is a beautiful cup and handle pattern which justifies strength.
This is an exceptionally good chart for a positional trade to buy on dips till 300 with an SL of 260.
A swing trade is risky at CMP with SL of below 290 DCB.
Targets can be 370, 400 and above.
Note:-
Idea is shared for educational purposes only. It should not be considered as a recommendation.

D-Link (India) Ltd.D-Link (India) Ltd. (1D)
CMP 318.30
Stock showing strength
At All Time High
Breakout of Cup and Handle Pattern on Weekly Time-frame
Continuously Higher High Higher Low Pattern intact on Daily Chart
Stock has given Breakout of previous Resistance and Retested that level

DLINKINDIA - Symmetric Triangle pattern 55% ROIAll details are given on chart. If you like the analyses please do share it with your friends, like and follow me for more such interesting charts.
Disc - Am not a SEBI registered. Please do your own analyses before taking position. This post is only for educational purposes and not a trading recommendation

Buy Long-D-Link at 196 for target of 268,SL-188,Exp.returns-36%NSE:DLINKINDIA Cup and Handle pattern break out with high volume. timeframe 45-55 days

D Link India Sun Storm Investment Trading Desk & NexGen Wealth Management Service Present's: SSITD & NexGen Portfolio of the Week Series
Focus: Worldwide
By Sun Storm Investment Research & NexGen Wealth Management Service
A Profit & Solutions Strategy & Research
Trading | Investment | Stocks | ETF | Mutual Funds | Crypto | Bonds | Options | Dividend | Futures |
USA | Canada | UK | Germany | France | Italy | Rest of Europe | Mexico | India
Disclaimer: Sun Storm Investment and NexGen are not registered financial advisors, so please do your own research before trading & investing anything. This is information is for only research purposes not for actual trading & investing decision.
#debadipb #profitsolutions

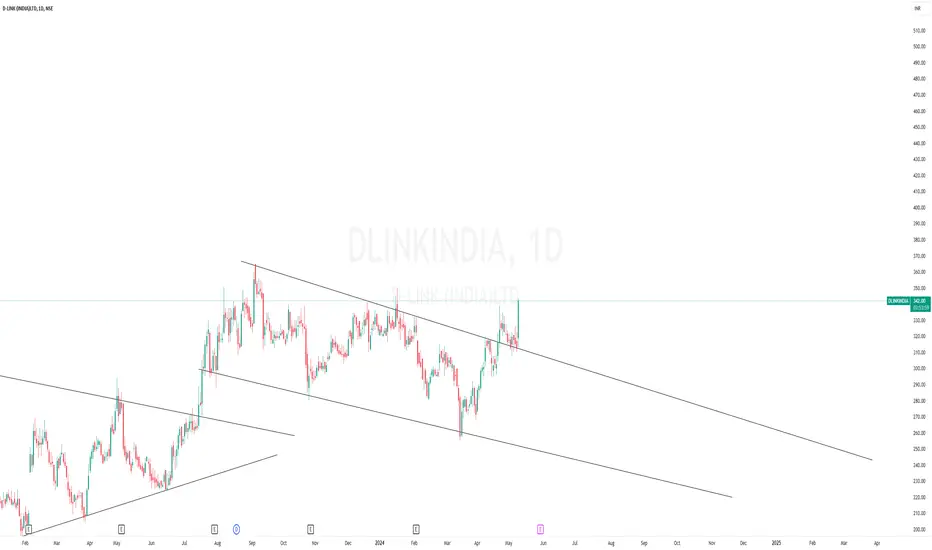
DLINKINDIA swing trade ideaDLINKINDIA about to break out triangle pattern if broken and settled can be a potential swing trade.
please do you own research and money management.
THIS IS NOT A FINANCIAL ADVICE
BEST REGARDS

Dlink Retracement Buy OpportunityRetest Done Rsi 62 .Upside Imminent for the Target of 227 with SL 160

Dlink looks good cmp 178
trgt 10%
Disclaimer:
All information shared is just for educational purposes.
By no means shall we be accountable for any debits/losses amounting out of it.
We are not SEBI registered Analysts, so please consult your Investment Advisor and take rational decisions.

