DMART--Head & Shoulders??Head and shoulders pattern is identified in this stock.
we have a chance of right shoulder formation. keep safe in this area.
price is now near to Right shoulder
on bottom we have a strong support lies at 3550 levels.
if price breaks the neckline we have a support lies at 3550.
multiple times price rejection to topside is observed from 3650 levels, but we have demand zone, it wants to test the demand zone.
keep in long side from support levels,
if neckline failed to push the price downside we have a continuation from this support levels, upside.
If Demand zone fails large sell off is going to observe in this stock.
DMART trade ideas

$dmartno brainer buy as and forget will outpeform your index for sure
close to 200 ema reclaim 21 ema and we keep going
think India overtook china in april in terms of population growth
so people gotta eat shit pray.. hence this is a safe bet after the hammering its got
apologies for the burst of idea's only way to find gems
as for targets look for ath plus 30% time frame a few years


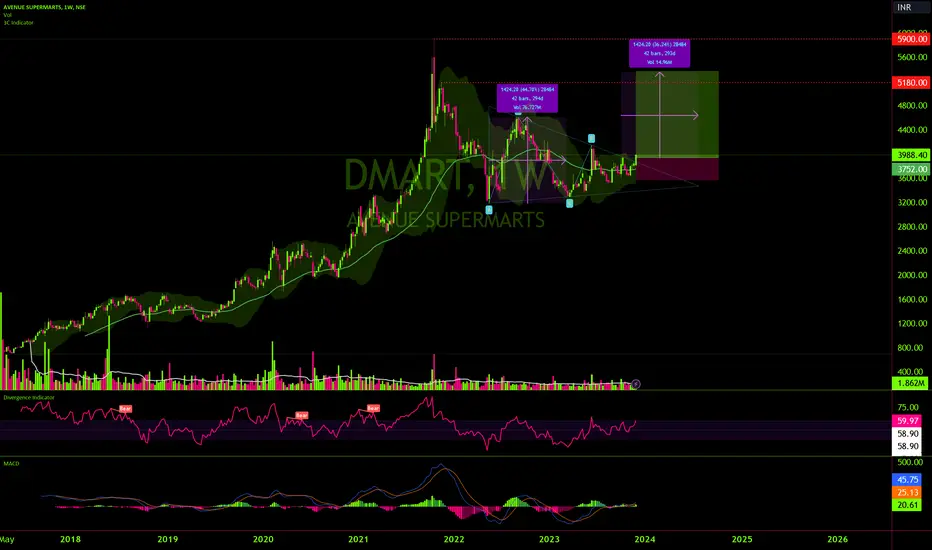
DMART one more Upward Impulse Wave about to form.
According tenth Elliott Wave Theory Price forms a 5 Wave Sequence structure before the major Correction, here we see that we have Wave 1, 2, 3(strongest upmove), Wave 4(correction), are complete.
Currently Price has formed a Quarterly Demand which has its LegOut closed above the EMa which indicates a Strong Buying and Price hasn't violated any Supply which signifies there was a temporary correction which is over and now Price is ready to Shoot above the end point of Wave 3, hence Target derived is Rs. 6000.00
This is a Trade where the reward is amazing against the minimum risk defined.


DMART Daily timeframe analysis for long term
NSE:DMART about to breakout 4057 level.
We can see long term move above 4075 with SL of 3850 and can average till 3889.
Major targets levels are highlighted in blue lines.

DMART - upside potential breakout
Stock has been on the contracting cycle for the whole year of 2023, possible breakout in the next 2 months.
Possible breakout to 52 week high over the span of the next year 2024
Build positions for the next 3 months which is more than enough time to build a considerable position
stop loss - needed if u r a swing trader, but this stock is a long term game
key points:-
market share competition is heavy among competitors
Dmart has become the norm and has considerable foot traffic in all Tier cities.
Expansion process is ongoing which will definitely bump up the value of the stock in coming quarters
strictly educational and personal note purposes. trade or invest at your own risk

DMARTFundamentally very strong stock break out with gud volume above its congestion zone.
Today volume is very big. if it crosses today high. then it will be gud buy.
sl will green candle low.
it has gud potential upside target. follow strict sl & proper risk reward ratio. this is the only holy grail in the market.

DMART Chartshowing tringular break out
need to sustain above 3950 -4000 level
upside level as per risk and reward

DMART may start new UP-TREND.Price created a triangle pattern on weekly TF and currently trying to break it, if buyers stays strong we can see a good move in DMART/Avenue Supermarts.
All the details are given on chart.
Take action on your own Risk!


DMART : Booked a profit of 16.79% on the invested capitalNifty is approaching the psychological level of 21,000, which could serve as a crucial inflection point. There is a possibility of a sell-off in the near future due to profit booking by market participants, potentially impacting the overall market.
Furthermore, given the current valuation and taking into account the broader macro and microeconomic conditions, I do not feel comfortable holding onto the stock any longer. Therefore, I am opting to book profits at a gain of approximately 16.79% from my average entry levels.
While I acknowledge the possibility of a 7% upside move, I am willing to forgo that potential gain given the overall risks associated with holding onto the scrip at this point.
I will consider re-entering the stock if the price retreats to the lower end of the channel line, taking into consideration the overall market scenario at the moment.

Dmart will give you good return after having bad resultsLong term break out hold for long. Investment buy for long and no sl

DMART looks bullishDMART looks bullish on the weekly time frame.
It has been consolidating for a few weeks and recently broke the triangle pattern on the upside.
We can measure the mouth of the triangle and measure it from the break line for the target.
We can also consider an all-time high as a short-term target.
Daily and weekly RSI are above 60 and crossing 60, respectively. The monthly RSI is inclining and close to 60.
The volume is increasing as it breaks the trend line.
Even if entering the trade just slightly below the CMP (Current Market Price), it can achieve over 1:3 RRR (Risk to Reward Ratio).
DMartDMart
Breaking out of the flag pole after a very long time and it is going to be along with a 5 over 20 monthly SMA
Huge volumes being soon and over 60 percent of delivery
Is it time for large caps?

DMART LONG SWING TRADE After a long downside stock Breakout trendline.
Price above Moving averages indicate very Bullish chart set-up.
Go for long if price above today closing price.
Macd Bullish
RSI Bullish
Disclaimer This is my personal view for education purpose only
No Buy sell recommendations.

Possibilities of DMARTNSE:DMART Finally stock break resistance of trendline and goes to bullish territory, now stock ready to upmove. If stock give closing on daily timeframe basis below trendline, take stoplossl and exit.
ENTRY- CMP
TRAGET- 4075
SL- 3800 OR Breakdown trendline
I am not SEBI registered, I am not responsible for any of your Profit/loss with this channel's suggestion. Please Consult your financial advisor before making any investment. I am providing trade views only for educational purpose

Dmart - hold the position and will move once it crosses the 3950DMart > 3950.
Currently hold the position between 3300 to 3950

Buy DMART - Level mark in the chartFantastic chance Risk reward: 1:1. Buy close to 3700 and maintain stop loss.
Risk: 0.5-1 % of your portfolio.

DMART - Long for the festive seasonDMART has shown a reversal on the shorter TF and is looking to perform for the festive season. The alignment of this reversal is well suited with Festive season.
Looking forward to some short term upside movement. Even though economy has to crash one day (sooner or later)

Ready To breakout Falling Wedge chart pattern Avenue Supermaarts wait for one day stay for trendline 4 time already touch trendline so chance is high break the trendline is break now best of luck

AVENUE SUPERMARTS LONG SWING IDEA AVENUE SUPERMARTS is now trading at 3935.85
for now the stock is at the trendline breakout condition.
so the entry is expected between
entry : 3853.00 to 3935.00
respectively .
and the target will be expected
target : 4315.00
this is just an idea for an trade
please do your own analysis .

DMART is giving breakout after a good consolidation.DMART is giving a good breakout after the consolidation for 2 years. The long term Weekly support (trend line) has also been respected. The Resistance (trend line) has also been respected and touched almost 5 times. Now the breakout has happened. Expecting a good up-move after this.
