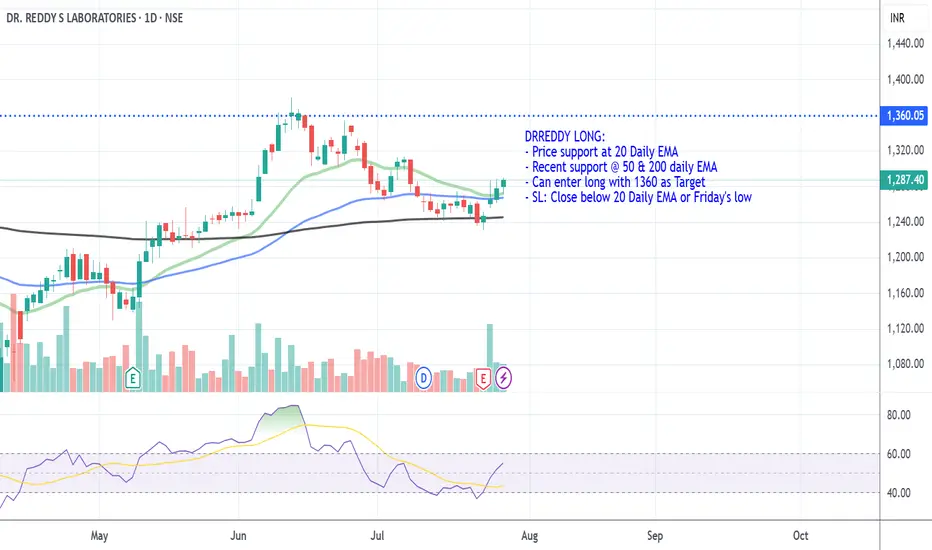
DRREDDY LONG_Support @ 20 DEMADRREDDY LONG:
- Price support at 20 Daily EMA
- Recent support @ 50 & 200 daily EMA
- Can enter long with 1360 as Target
- SL: Close below 20 Daily EMA or Friday's low
Next report date
—
Report period
—
EPS estimate
—
Revenue estimate
—
68.10 INR
56.54 B INR
325.54 B INR
602.90 M
About DR. REDDY S LABORATORIES
Sector
Industry
CEO
Erez Israeli
Website
Headquarters
Hyderabad
Founded
1984
ISIN
INE089A01031
FIGI
BBG000CQND59
Dr. Reddy's Laboratories Ltd. engages in the manufacture and marketing of pharmaceutical products. It operates through the following segments: Global Generics, Pharmaceutical Services and Active Ingredients, and Others. The Global Generics segment consists of manufacturing and marketing of prescription and over-the-counter finished pharmaceutical products ready for consumption by the patient, marketed under a brand name or as generic finished dosages with therapeutic equivalence to branded formulations. The Pharmaceutical Services and Active Ingredients segment focuses on manufacturing and marketing of active pharmaceutical ingredients and intermediates, also known as API, which are the principal ingredients for finished pharmaceutical products. The Others segment includes the operations of the subsidiary of the company. The company was founded by Kallam Anji Reddy on February 24, 1984 and is headquartered in Hyderabad, India.
Related stocks
Technical bounce back on cardsRevenue: ₹8,545 crore (~11% YoY increase)
Net Profit (PAT): ₹1,418 crore (~2% YoY growth)
North America generics revenue declined ~11% to ₹3,412 crore due to pricing pressures, while Europe surged 142% YoY
Consensus estimates (SimplyWall.st): Average target at ₹1,289, with bullish/bearish range ₹

DRREDDY LONG_Support @ 20 Daily EMADRREDDY LONG:
- Price support at 20 Daily EMA
- Recent support @ 50 daily EmA
- Can enter long with 1360 as Target
- SL: Close below 20 Daily EMA or Friday's low

DRREDDY Short_Broke down from 20 DEMADRREDDY SHORT:
- Bearish Engulfing Candle
- Support broken 20 DEMA
- Price may retest 20 DEMA before going down (if its going down)
- Enter when the price is favorable in the lower timeframe
- Target: 50 DEMA

DRREDDY_Long_Bounce Back @ 20 Daily EMALooks Bullish.
Support near 20 DEMA
Bullish Engulfing Candle
Target 1360
SL Today's Low 1300
Enter when the Price makes Higher
low or tests the moving Avg

DR. REDDY Is becoming ready for downfallAfter proper price action formation DR. REDDY may fall sharply , my target for next 6 months to one year is 665, lets see what happens, but all this after only confirmation

DRREDDY🎯 Trade Setup Summary
Parameter Value
Trade Type BUY
Entry ₹1257
Stop Loss (SL) ₹1221
Risk ₹36
Target ₹1658
Reward ₹401
Risk-Reward (RR) 11.2
Last High ₹1421
Last Low ₹1020
🧠 Key Observations
Strong Bullish Confluence: All timeframes are in an UP trend, with demand zones stacking up across HTF, MTF

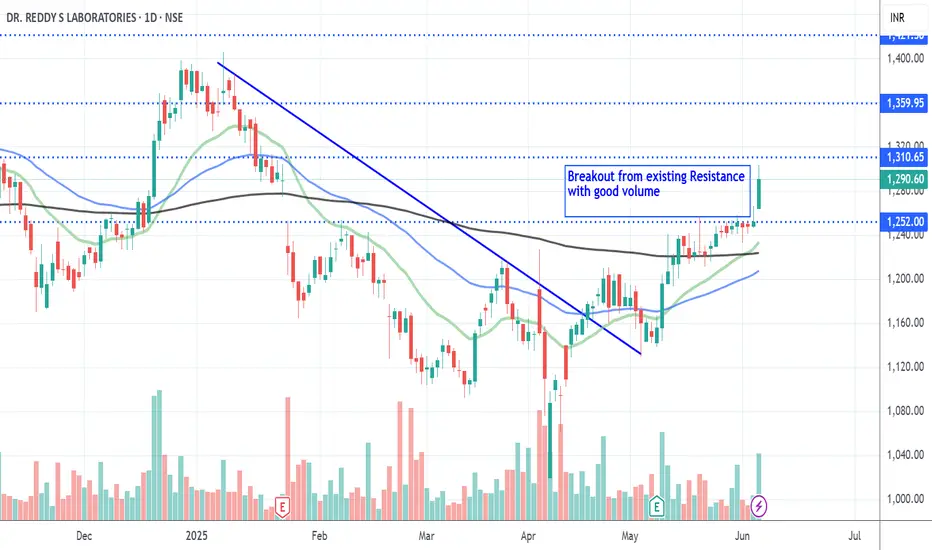
DRREDDY_LongBreakout from existing Resistance with good volume.
Wait till good entry point & Enter.
SL - Price close below 20 DEMA.
Disc: Educational Purpose only.
This chat is education purpose only.Dr. Reddy is ready to break out
Enter at CMP 1240 with SL of 1210
target is 1400.

Review and plan for 12th May 2025 Nifty future and banknifty future analysis and intraday plan.
Quarterly results.
This video is for information/education purpose only. you are 100% responsible for any actions you take by reading/viewing this post.
please consult your financial advisor before taking any action.
----Vinaykuma

See all ideas
Summarizing what the indicators are suggesting.
Neutral
SellBuy
Strong sellStrong buy
Strong sellSellNeutralBuyStrong buy
Neutral
SellBuy
Strong sellStrong buy
Strong sellSellNeutralBuyStrong buy
Neutral
SellBuy
Strong sellStrong buy
Strong sellSellNeutralBuyStrong buy
An aggregate view of professional's ratings.
Neutral
SellBuy
Strong sellStrong buy
Strong sellSellNeutralBuyStrong buy
Neutral
SellBuy
Strong sellStrong buy
Strong sellSellNeutralBuyStrong buy
Neutral
SellBuy
Strong sellStrong buy
Strong sellSellNeutralBuyStrong buy
Displays a symbol's price movements over previous years to identify recurring trends.
Frequently Asked Questions
The current price of DRREDDY is 1,288.40 INR — it has decreased by −0.11% in the past 24 hours. Watch DR. REDDY S LABORATORIES stock price performance more closely on the chart.
Depending on the exchange, the stock ticker may vary. For instance, on NSE exchange DR. REDDY S LABORATORIES stocks are traded under the ticker DRREDDY.
DRREDDY stock has risen by 2.10% compared to the previous week, the month change is a −3.94% fall, over the last year DR. REDDY S LABORATORIES has showed a −6.91% decrease.
We've gathered analysts' opinions on DR. REDDY S LABORATORIES future price: according to them, DRREDDY price has a max estimate of 1,660.00 INR and a min estimate of 990.00 INR. Watch DRREDDY chart and read a more detailed DR. REDDY S LABORATORIES stock forecast: see what analysts think of DR. REDDY S LABORATORIES and suggest that you do with its stocks.
DRREDDY reached its all-time high on Aug 21, 2024 with the price of 1,421.50 INR, and its all-time low was 7.20 INR and was reached on Dec 10, 1996. View more price dynamics on DRREDDY chart.
See other stocks reaching their highest and lowest prices.
See other stocks reaching their highest and lowest prices.
DRREDDY stock is 0.65% volatile and has beta coefficient of 0.63. Track DR. REDDY S LABORATORIES stock price on the chart and check out the list of the most volatile stocks — is DR. REDDY S LABORATORIES there?
Today DR. REDDY S LABORATORIES has the market capitalization of 1.06 T, it has increased by 0.74% over the last week.
Yes, you can track DR. REDDY S LABORATORIES financials in yearly and quarterly reports right on TradingView.
DR. REDDY S LABORATORIES is going to release the next earnings report on Oct 24, 2025. Keep track of upcoming events with our Earnings Calendar.
DRREDDY earnings for the last quarter are 17.02 INR per share, whereas the estimation was 18.38 INR resulting in a −7.39% surprise. The estimated earnings for the next quarter are 17.59 INR per share. See more details about DR. REDDY S LABORATORIES earnings.
DR. REDDY S LABORATORIES revenue for the last quarter amounts to 85.45 B INR, despite the estimated figure of 87.01 B INR. In the next quarter, revenue is expected to reach 88.18 B INR.
DRREDDY net income for the last quarter is 14.18 B INR, while the quarter before that showed 15.94 B INR of net income which accounts for −11.05% change. Track more DR. REDDY S LABORATORIES financial stats to get the full picture.
Yes, DRREDDY dividends are paid annually. The last dividend per share was 8.00 INR. As of today, Dividend Yield (TTM)% is 0.63%. Tracking DR. REDDY S LABORATORIES dividends might help you take more informed decisions.
DR. REDDY S LABORATORIES dividend yield was 0.70% in 2024, and payout ratio reached 11.78%. The year before the numbers were 0.65% and 11.95% correspondingly. See high-dividend stocks and find more opportunities for your portfolio.
As of Jul 29, 2025, the company has 27.81 K employees. See our rating of the largest employees — is DR. REDDY S LABORATORIES on this list?
Like other stocks, DRREDDY shares are traded on stock exchanges, e.g. Nasdaq, Nyse, Euronext, and the easiest way to buy them is through an online stock broker. To do this, you need to open an account and follow a broker's procedures, then start trading. You can trade DR. REDDY S LABORATORIES stock right from TradingView charts — choose your broker and connect to your account.
Investing in stocks requires a comprehensive research: you should carefully study all the available data, e.g. company's financials, related news, and its technical analysis. So DR. REDDY S LABORATORIES technincal analysis shows the buy rating today, and its 1 week rating is buy. Since market conditions are prone to changes, it's worth looking a bit further into the future — according to the 1 month rating DR. REDDY S LABORATORIES stock shows the strong buy signal. See more of DR. REDDY S LABORATORIES technicals for a more comprehensive analysis.
If you're still not sure, try looking for inspiration in our curated watchlists.
If you're still not sure, try looking for inspiration in our curated watchlists.