EICHERMOT : Elliott Wave FormationElliott Wave Formation: Wave 3 is getting formed, which is the largest swing in the Elliott wave.
Try to ride as far as possible.
Wave 3 Vertical length=1.618× Wave 1 Vertical length
Target = ~6500
EICHERMOT trade ideas

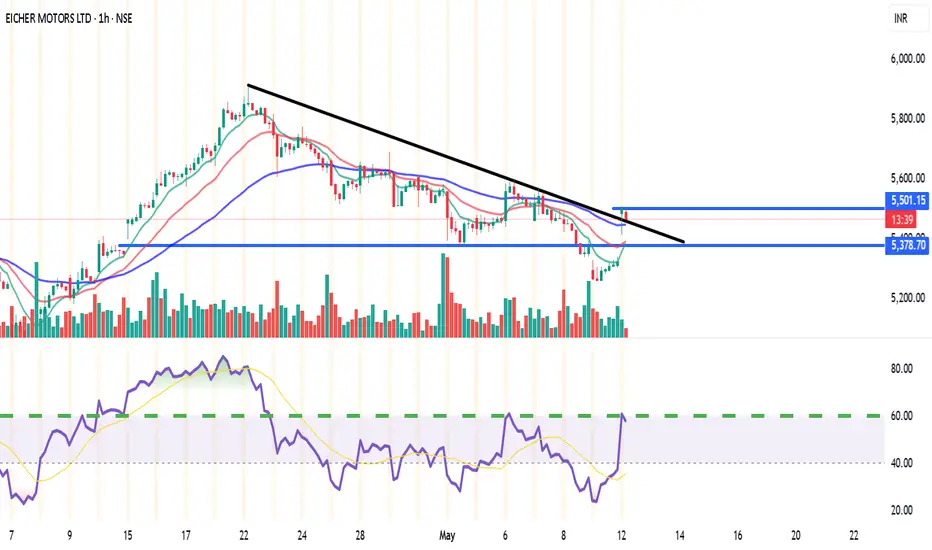
Eicher Motors breaks?Eicher Motors breaks out of resistance with volume eyes set on the upper trendline near 6011.
After weeks of consolidation between 5250 and 5575, Eicher Motors has finally broken out of its sideways zone with strong follow-through and bullish intent.
Price not only cleared horizontal resistance but also pushed above the red supply zone around 5645, confirming buyer dominance.
This breakout aligns with the broader ascending channel that has been intact since March. The structure now hints at a potential continuation toward the upper channel line, projected near 6011 level highlighted risk-reward 1:3,
From a fundamental lens, Eicher has seen improved export numbers and rising traction in the premium segment, especially with Royal Enfield's increasing demand in overseas markets. If macro sentiment remains supportive, this technical breakout could be backed by earnings momentum in the upcoming quarters.
On the flip side, a failure to sustain above ₹5575 may drag the price back to test the breakout zone around ₹5430–₹5250.
Like, comment your thoughts, and share this post
Explore more stock ideas on the right hand side your feedback means a lot to me!
Disclaimer: This post is for educational purposes only and should not be considered a buy/sell recommendation.

Eicher Motors
I'm not a SEBI REGISTERED ANYLISIS
just for learning purpose
above the blue line close in D chart candle i will buy and put strictly SL to below red line...once candle close below Red line in D chart...i will close the Trade...
target check the chart
WAIT FOR ENTRY......then after
WAIT FOR TARGET...... or
WAIT FOR STOPLOSS
educational purpose only
oits simple ORB WITH VOLUME BREAKOUT STRATEGY...with small condition apply for selecting the stocks
owt not response for your profit and loss

Riding the Final Wave: Eicher Motors Aiming for the MOON.🔍 Wave Structure Analysis (Elliott Wave Count):
The chart follows a classic 5-wave impulsive structure:
Wave i → ii → iii → iv → v (subwaves of primary wave 1).
Wave (ii) retraced ~38.2% of Wave (i), showing healthy correction.
Wave (iii) extended well, with internal sub-waves clearly marked (i, ii, iii, iv, v).
Current move is likely Wave v of 1, still in progress.
📐 Fibonacci Levels (Retracement & Projection):
Wave (ii) retraced to 0.382 (₹2,101.80) — ideal for wave ii corrections.
Wave (iii) reached 1.618 extension of Wave (i) at around ₹5,048.85 — confirming it as an extended wave.
Wave (iv) respected the 0.382 retracement zone from Wave (iii), retraced till around ₹4,208.70 – ₹4,538.55.
Projected Target for Wave (v): ~₹7,635.55 (also marked as end of Wave 1 in pink).
📊 Indicators:
RSI: Currently at 57.09, just above the neutral zone.
Indicates moderate bullish momentum, not overbought.
RSI is rising, supporting the continuation of wave v.
Volume: Fairly steady — no divergence observed, backing the price action strength.
✅ Key Support Zones:
₹4,208 – ₹4,538: Support cluster (Fibo retracement zone of wave iv).
₹2,766.05 and ₹2,101.80: Long-term supports from earlier wave structures and retracement levels.
⚠️ Verification & Corrections:
✅ Wave labeling and Fibonacci levels appear technically correct.
✅ Subwaves are well-defined and follow Elliott Wave rules:
Wave iii is not the shortest.
Wave iv does not enter Wave i territory.
⚠️ Keep an eye on divergence or failure at ₹5,900–₹6,000 zone — critical resistance before ₹7,600.
📌 Summary:
Eicher Motors is in the final stages of completing Wave v of Primary Wave 1, with a projected upside target near ₹7,635. RSI and volume confirm a healthy uptrend, and Fibo levels add credibility. The structure appears valid and aligns well with classical Elliott Wave and Fibonacci guidelines.

Eicher Motors buy on dips Eicher Motors buy on dips Target 5900 and stop loss 5250
Completed Double bottom reversal on hourly.. intial upside expected till 5900.
Entry 5400 , target 5900 and stop loss 5250
EICHERMOT Technical Analysis🏍️ EICHERMOT Technical Analysis (Daily Chart) – May 30, 2025
Current Price: ₹5,333.00
Change: -₹46.00 (−0.86%)
🔍 Chart Insights:
Trendline Support Test: Price is hovering near a key ascending trendline. A breakdown could trigger a deeper correction.
Possible Scenarios:
1. Bullish Bounce: If the trendline holds, a bounce back toward the recent highs is possible.
2. Bearish Breakdown: If broken, downside targets are marked at:
₹4,508.75 – Major support and first demand zone.
₹4,253.85 – Extended downside target if selling pressure increases.

Eicher motor is must watch stockEicher motor is showing downside journey for short term, but it has demand zone around 5190, so watch how it behaves around that level and take decision around it for upside targets,

Swing Trading for EICHERMOTMulti-Timeframe Market Analysis
🕐 1-Hour Chart (Higher Timeframe – HTF)
Trend: Bullish
Structure: The market recently formed a Break of Structure (BOS) by taking out the previous swing high.
Retracement: Price has retraced to the 72% Fibonacci level, indicating a potential area for continuation of the uptrend.
Key Zone: Price has now tapped into a significant 1H Order Block (OB), which may act as a strong support zone.
🕒 15-Minute Chart (Mid Timeframe – MTF)
Change of Character (ChoCh): A bullish ChoCh has occurred, signaling a shift in internal structure from bearish to bullish.
Implication: This confirms alignment with the bullish HTF trend and strengthens the case for a potential long entry.
🕐📉 Lower Timeframe (3-Minute or 1-Minute – LTF)
Confirmation Required: Wait for one of the following before entering:
ChoCh (bullish structure shift)
Flip Zone (resistance turning into support)
Entry Strategy: Enter a long position after confirmation from LTF price action.
Stop Loss: Place below the LTF swing low or the 1H OB (based on risk tolerance).
Target: Previous 1H high or next significant liquidity level.

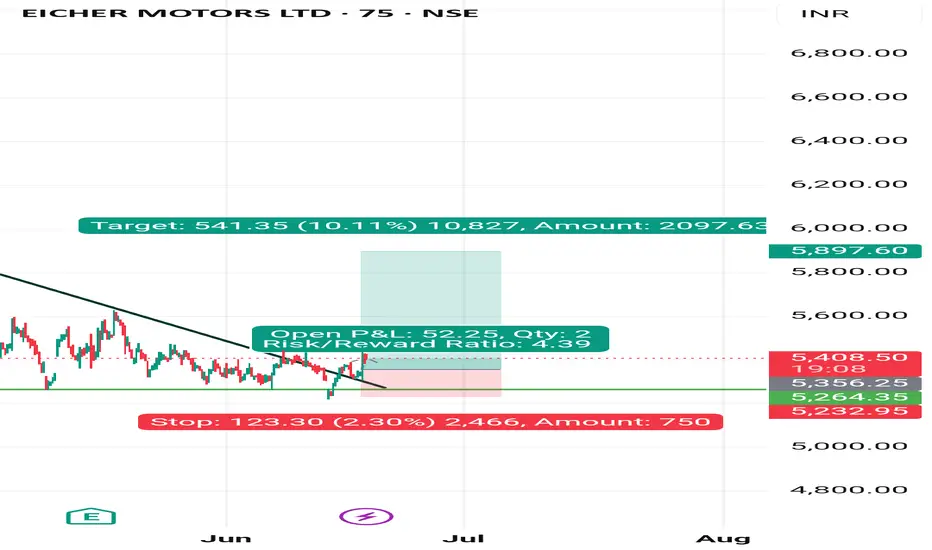
EICHERMOT (NSE) – Bullish Setup on 15min & 1H🔑 Trade Plan:
📥 Buy Above: ₹5485 (above current resistance & candle body highs)
🎯 Targets:
T1: ₹5527 (Pivot R1)
T2: ₹5555
🛡️ Stop Loss: ₹5380 (below 13 EMA & Supertrend support)
📊 Technical Signals:
RSI: 58.08 – Bullish momentum, still room to run
%B (BB): 0.77 – Close to breakout from upper band
EMA Crossover: 9 EMA > 13 EMA – Short-term bullish crossover confirmed
Supertrend: Support at ₹5322, aligning with bullish reversal
Volume: Spike during recent green candles signals strong buying interest
⚙️ Strategy Notes:
Use 15min chart for entry timing post breakout
Tighten SL to cost after T1 hits
Ideal for short-term intraday/swing traders
For Education Purposes Only
Weekly Range bound | 4H swingFellow trader,
Eicher motors has broken the range bound market in weekly timeframe, and now the market is re-testing.
Aggressive entry : Whoever enter the market immediately after the breakout
Conservative entry : Whoever enter after the market re-test.
The weekly range bound breakout target is 5684 & the SL for the same is 4548
Now in the re-test, there is a clear formation of a swing in 4H/1D timeframe, after a inverted H&S pattern breakout in 1H timeframe consider to enter the trade based on this swing.
Considering the pattern of Weekly or 4H time frame trade can be taken, the SL and Targets are in the chart.
The Risk : Reward ratio for the swing is 1:4.47
Sensibull : sbull.co

Bullish continuation Brook style Here’s a brief Al Brooks-style analysis of the Eicher Motors daily chart:
The stock is in a strong uptrend channel, indicating sustained bullish momentum.
A recent pullback formed a bull flag, and price has bounced near the channel's lower boundary, suggesting buyer interest at support.
The candle breaking the flag is strong, hinting at resumption of the uptrend.
Potential target is near 6214, the upper boundary of the channel or a measured move from the flag breakout.
Support zone is around 5200–5186. If the price breaks below this zone, it could trigger a deeper correction.
Summary: Bullish continuation setup within a rising channel. Watch for strength above 5550 for a move toward 6200+.

EICHER MOTOREICHER MOTOR IS looking good to buy around 5000 to 5150 for swing trading, after reversal confirmation for upside, till then watch it observe it, learn

EICHERMOT for Positional TradeEICHERMOT is good for Positional trade setup forming higher high and higher lows. Target is the trend line

EICHER MOTORS LTD S/RSupport and Resistance Levels:
Support Levels: These are price points (green line/shade) where a downward trend may be halted due to a concentration of buying interest. Imagine them as a safety net where buyers step in, preventing further decline.
Resistance Levels: Conversely, resistance levels (red line/shade) are where upward trends might stall due to increased selling interest. They act like a ceiling where sellers come in to push prices down.
Breakouts:
Bullish Breakout: When the price moves above resistance, it often indicates strong buying interest and the potential for a continued uptrend. Traders may view this as a signal to buy or hold.
Bearish Breakout: When the price falls below support, it can signal strong selling interest and the potential for a continued downtrend. Traders might see this as a cue to sell or avoid buying.
20 EMA (Exponential Moving Average):
Above 20 EMA(50 EMA): If the stock price is above the 20 EMA, it suggests a potential uptrend or bullish momentum.
Below 20 EMA: If the stock price is below the 20 EMA, it indicates a potential downtrend or bearish momentum.
Trendline: A trendline is a straight line drawn on a chart to represent the general direction of a data point set.
Uptrend Line: Drawn by connecting the lows in an upward trend. Indicates that the price is moving higher over time. Acts as a support level, where prices tend to bounce upward.
Downtrend Line: Drawn by connecting the highs in a downward trend. Indicates that the price is moving lower over time. It acts as a resistance level, where prices tend to drop.
Disclaimer:
I am not a SEBI registered. The information provided here is for learning purposes only and should not be interpreted as financial advice. Consider the broader market context and consult with a qualified financial advisor before making investment decisions.

Reaching Congestion Zone.Hello
Most people Do get Fascinated just by seeing last days 6% move and tempted to buy the stock,
I would really wanted to tell them please Never do this and if you do so and what if it ll Reverse from there, and You ll curse yourself that market is against you,
and That is not the Truth.
Anyways Here is a Update For you.
Congestion Zone 3646-3763
and As peer me 3300-3350 is Buy Zone
Place Your Stop Loss Below 2800 On WCB
and Look for target 4149 & 4960
so Basically it is a more then 1:2.5 when it go to 4960.
Its a weekly Timeframe Trade so Keep that in mind and Trade Safe.
All the best.
Gratify if you appreciate the practice then you can like it, share it and
If you want me to investigate any chart for you then would cherish doing that for you.
Thank you for your time and support.
Stay safe.

Eicher Motors (NSE: EICHERMOT): Bullish Breakout Alert!Eicher Motors is exhibiting a bullish setup on the weekly chart, with strong potential for upward movement.
📊 Chart Overview:
Breakout Confirmed: Price has broken above the ₹5,100 resistance zone, which had acted as a significant supply area.
Retest Likely: A pullback to the breakout zone could offer an ideal entry point for long positions.
🎯 Fibonacci Targets:
Breakout Level: ₹5,200 (0% Fibonacci extension).
Target 1: ₹5,875 (61.8% Fibonacci extension).
Target 2: ₹6,250 (100% Fibonacci extension).
📈 Trading Strategy:
✅ Entry Plan:Wait for a retest of ₹5000-5100 as support. Enter upon bullish reversal signals (e.g., hammer, bullish engulfing candles, or volume confirmation).
❌ Stop-Loss: Place a stop-loss slightly below ₹5,000 to mitigate risks.
🔄 Trailing Stop-Loss: Start with a fixed stop-loss below the support zone.
Adjust as follows:
₹5,400 (after reaching initial profits).
₹5,875 (first target).
⚠️ Disclaimer: This is for informational purposes only and not financial advice. Always conduct your research and consult a financial professional before making trading decisions.

EICHER MOTOROne can keep an eye on this script, good price action forming, lets see where it goes...

Amazing breakout on WEEKLY Timeframe - EICHERMOTCheckout an amazing breakout happened in the stock in Weekly timeframe, macroscopically seen in Daily timeframe. Having a great favor that the stock might be bullish expecting a staggering returns of minimum 25% TGT. IMPORTANT BREAKOUT LEVELS ARE ALWAYS RESPECTED!
NOTE for learners: Place the breakout levels as per the chart shared and track it yourself to get amazed!!
#No complicated chart patterns
#No big big indicators
#No Excel sheet or number magics
TRADE IDEA: WAIT FOR THE STOCK TO BREAKOUT IN WEEKLY TIMEFRAME ABOVE THIS LEVEL.
Checkout an amazing breakout happened in the stock in Weekly timeframe.
Breakouts happening in longer timeframe is way more powerful than the breakouts seen in Daily timeframe. You can blindly invest once the weekly candle closes above the breakout line and stay invested forever. Also these stocks breakouts are lifelong predictions, it means technically these breakouts happen giving more returns in the longer runs. Hence, even when the scrip makes a loss of 10% / 20% / 30% / 50%, the stock will regain and turn around. Once they again enter the same breakout level, they will flyyyyyyyyyyyy like a ROCKET if held in the portfolio in the longer run.
Time makes money, GREEDY & EGO will not make money.
Also, magically these breakouts tend to prove that the companies turn around and fundamentally becoming strong. Also the magic happens when more diversification is done in various sectors under various scripts with equal money invested in each N500 scripts.
The real deal is when to purchase and where to purchase the stock. That is where Breakout study comes into play.
LET'S PUMP IN SOME MONEY AND REVOLUTIONIZE THE NATION'S ECONOMY!

EICHER MOTORS Breakout happend in this stock with rising 200dma and RS indicator is also showing strength.
Keep your risk and reward ratios according to your own preferance.
This is for educational purpose, do your own research before investing

EICHERMOT - 8 months RECTANGLE══════════════════════════════
Since 2014, my markets approach is to spot
trading opportunities based solely on the
development of
CLASSICAL CHART PATTERNS
🤝Let’s learn and grow together 🤝
══════════════════════════════
Hello Traders ✌
After a careful consideration I came to the conclusion that:
- it is crucial to be quick in alerting you with all the opportunities I spot and often I don't post a good pattern because I don't have the opportunity to write down a proper didactical comment;
- since my parameters to identify a Classical Pattern and its scenario are very well defined, many of my comments were and would be redundant;
- the information that I think is important is very simple and can easily be understood just by looking at charts;
For these reasons and hoping to give you a better help, I decided to write comments only when something very specific or interesting shows up, otherwise all the information is shown on the chart.
Thank you all for your support
🔎🔎🔎 ALWAYS REMEMBER
"A pattern IS NOT a Pattern until the breakout is completed. Before that moment it is just a bunch of colorful candlesticks on a chart of your watchlist"
═════════════════════════════
⚠ DISCLAIMER ⚠
Breakout Area, Target, Levels, each line drawn on this chart and any other content represent just The Art Of Charting’s personal opinion and it is posted purely for educational purposes. Therefore it must not be taken as a direct or indirect investing recommendations or advices. Entry Point, Initial Stop Loss and Targets depend on your personal and unique Trading Plan Tactics and Money Management rules, Any action taken upon these information is at your own risk.
═════════════════════════════

Breakout in Eicher MotorStock has been in accumulation phase from 6 months.
Today is a good breakout with huge volume and some news for overall sector.
Shares of Royal Enfield-maker Eicher Motors rose over 6% on January 2 as the company reported 25% jump in motorcycle sales in December.
In a stock exchange filing, the company said its total motorcycle sales in December rose 25% to 79,466 units as against 63,387 units in the year-ago period.
The company's international business outperformed by rising 90% to 11,575 units.
Above paragraph is borrowed from news portal.
Strategy would be to wait for PULLBACK and let price retrace back to 5150 and then buy, now since price have moved away reward to risk ratio is not favorable.

Eicher Motors might motor along. Eicher Motors Ltd. engages in the development, design, manufacture, assembly and sale of two-wheelers, as well as related parts and accessories. It operates through Domestic and Overseas geographical segments. The Domestic segment includes sales and services to customers located in India. The Overseas segment includes sales and services rendered to customers located outside India.
Eicher Motors Ltd. CMP is 4838.50. The Positive aspects of the company are Company with Low Debt, Company able to generate Net Cash - Improving Net Cash Flow, Company with Zero Promoter Pledge. The Negative aspects of the company are high Valuation (P.E. = 31.1), Promoter decreasing their shareholding, Companies with growing costs YoY for long term projects, De-growth in Revenue, Profits and Operating Profit Margin and Increasing Trend in Non-Core Income.
Entry can be taken after closing above 4843 Targets in the stock will be 4931 and 4991. The long-term target in the stock will be 5059 and 5119. Stop loss in the stock should be maintained at Closing below 4603 or 4481 depending on your risk taking ability.
Disclaimer: The above information is provided for educational purpose, analysis and paper trading only. Please don't treat this as a buy or sell recommendation for the stock. We do not guarantee any success in highly volatile market or otherwise. Stock market investment is subject to market risks which include global and regional risks. We will not be responsible for any Profit or loss that may occur due to any financial decision taken based on any data provided in this message.
