EMAMI - BOTTOM FISHING BUYNSE:EMAMILTD Weekly bottom fishing location with buyers activation exactly at there.
EMAMILTD trade ideas

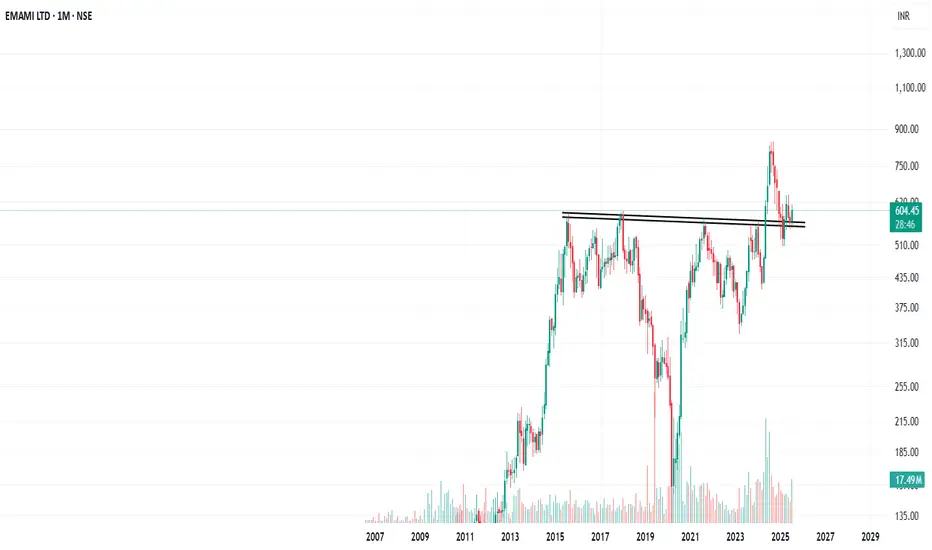
#Emami - a very proising setup for investment betEmami is taking support at the major breakout area. since its a monthly chart, in long term looks good for an investment.
Emami Ltd looking promising Emami Ltd retested multi year breakout. Keep monthly SL of 560 to ride the trend.


EMAMILTDNSE:EMAMILTD
One Can Enter Now ! Or Wait for Retest of the Trendline (BO) Or wait For better R:R ratio
Note :
1.One Can Go long with a Strict SL below the Trendline or Swing Low of Daily Candle.
2. Close, should be good and Clean.
3. R:R ratio should be 1 :2 minimum
4. Plan as per your RISK appetite
Disclaimer : You are responsible for your Profits and loss, Shared for Educational purpose

EMAMILTDDisclaimer:
This is not financial advice. Please do your own research or consult with a financial advisor before making any investment decisions. Investments in stocks can be risky and may result in loss of capital.

EMami LONGEmami
Qtrly Break Out
Monthly BUFL
Price Trading under Weekly & Daily BUFL
Entry 650-600
SL 595
Target 1300

Emami Ltd view for Intraday 22nd Nov #EMAMILTD Emami Ltd view for Intraday 22nd Nov #EMAMILTD
Resistance 640. Watching above 641 for upside movement...
Support area 630 Below 630 ignoring upside momentum for intraday
Support 630 Watching below 6288 for downside movement...
Resistance area 640
Above 640 ignoring downside move for intraday
Charts for Educational purposes only.
Please follow strict stop loss and risk reward if you follow the level.
Thanks,
V Trade Point

Emami Ltd view for Intraday 11th Nov #EMAMILTD Emami Ltd view for Intraday 11th Nov #EMAMILTD
Resistance 680. Watching above 681 for upside movement...
Support area 660. Below 670 ignoring upside momentum for intraday
Support 660.Watching below 670 for downside movement...
Resistance area 680
Above 670 ignoring downside move for intraday
Charts for Educational purposes only.
Please follow strict stop loss and risk reward if you follow the level.
Thanks,
V Trade Point

Emami Ltd view for Intraday 8th Nov #EMAMILTD Emami Ltd view for Intraday 8th Nov #EMAMILTD
Resistance 680. Watching above 681 for upside movement...
Support area 665. Below 670 ignoring upside momentum for intraday
Support 665 .Watching below 648 for downside movement...
Resistance area 663
Above 675-680 ignoring downside move for intraday
Charts for Educational purposes only.
Please follow strict stop loss and risk reward if you follow the level.
Thanks,
V Trade Point

EMAMI LTD Swing Long SetupEnter only when 15minute candle closes above the Entry Zone Price - 766
Target with Risk to reward 1:2 is 847.2
Stoploss only when 1 day candle closes below the price - 725.40
Note: This is not any financial advice, this is for education purpose only.

Emami Ltd. Right time to enter?Emami is engaged in manufacturing & marketing of personal care & healthcare products with an enviable portfolio of household brand names such as BoroPlus, Navratna, Fair and Handsome, Zandu Balm, Kesh King, Zandu Pancharishta, Mentho Plus Balm and others.
M.Cap is 34,398 Cr, Stock P/E 46.5.
The stock has gained only 15% from the high of pre-covid levels which is only 15% gain in the previous 7 years. Although it is in FMCG sector but the stock has not scaled up as other stocks.
It is expanding its portfolio buy acquiring stake in startups and buying brands from other companies.
It can be a strategic investment in the present market levels and result in an excellent buy in the future.
I am not a SEBI registered analyst.
Please do your own analysis before investing.
Do like and follow and share among your friends and family.
Thank you.

EMAMI LTD S/RSupport and Resistance Levels:
Support Levels: These are price points (green line/shade) where a downward trend may be halted due to a concentration of buying interest. Imagine them as a safety net where buyers step in, preventing further decline.
Resistance Levels: Conversely, resistance levels (red line/shade) are where upward trends might stall due to increased selling interest. They act like a ceiling where sellers come in to push prices down.
Breakouts:
Bullish Breakout: When the price moves above resistance, it often indicates strong buying interest and the potential for a continued uptrend. Traders may view this as a signal to buy or hold.
Bearish Breakout: When the price falls below support, it can signal strong selling interest and the potential for a continued downtrend. Traders might see this as a cue to sell or avoid buying.
20 EMA (Exponential Moving Average):
Above 20 EMA: If the stock price is above the 20 EMA, it suggests a potential uptrend or bullish momentum.
Below 20 EMA: If the stock price is below the 20 EMA, it indicates a potential downtrend or bearish momentum.
Trendline: A trendline is a straight line drawn on a chart to represent the general direction of a data point set.
Uptrend Line: Drawn by connecting the lows in an upward trend. Indicates that the price is moving higher over time. Acts as a support level, where prices tend to bounce upward.
Downtrend Line: Drawn by connecting the highs in a downward trend. Indicates that the price is moving lower over time. It acts as a resistance level, where prices tend to drop.
RSI: RSI readings greater than the 70 level are overbought territory, and RSI readings lower than the 30 level are considered oversold territory.
Combining RSI with Support and Resistance:
Support Level: This is a price level where a stock tends to find buying interest, preventing it from falling further. If RSI is showing an oversold condition (below 30) and the price is near or at a strong support level, it could be a good buy signal.
Resistance Level: This is a price level where a stock tends to find selling interest, preventing it from rising further. If RSI is showing an overbought condition (above 70) and the price is near or at a strong resistance level, it could be a signal to sell or short the asset.
Disclaimer:
I am not a SEBI registered. The information provided here is for learning purposes only and should not be interpreted as financial advice. Consider the broader market context and consult with a qualified financial advisor before making investment decisions.

52 Week High Strategy - Positional Trade Long TermDisclaimer: I am Not SEBI Registered adviser, please take advise from your financial adviser before investing in any stocks. Idea here shared is for education purpose only.
Stock is near 52 week high break out. Buy above the High and do not forget to keep stop loss best suitable for Positional Trading long Term. Keep this stock in watch list.
Target and Stop loss Shown on Chart. Initial Target Ratio 1:2. Exit only if Stock Price Close below 30 SMA on Weekly Chart.
Be Discipline, because discipline is the key to Success in Stock Market.
Trade what you See Not what you Think.

Emami Ltd intraday level for 13th Aug #EMAMILTD Emami Ltd intraday level for 13th Aug #EMAMILTD
Buying may witness above 812
Support area 804. Below ignoring buying momentum for intraday
Selling may witness below 804
Resistance area 812 Above ignoring selling momentum for intraday
Charts for Educational purposes only.
Please follow strict stop loss and risk reward if you follow the level.
Thanks,
V Trade Point

EmamiLtdEmamiLtd CMP 765
Looking at the chart,
It seems wave 3 (in green) is completed or soon be completed...
and we would start a Corrective wave 4...
which we can see till 675-610
once wave 4 is completed... it is a good pick for 1050+
Just a View!!
Vedang!
:)
Disclaimer: Chart is for study purpose only!!!

Emami Ltd
Target mentioned in chart ( Longterm play )
SL - As per your appetite
FUNDAMENTALS
Market Cap
₹ 30,088 Cr.
Current Price
₹ 689
High / Low
₹ 762 / 410
Stock P/E
41.3
Book Value
₹ 56.0
Dividend Yield
1.16 %
ROCE
32.6 %
ROE
30.7 %
Face Value
₹ 1.00
Price to book value
12.3
Intrinsic Value
₹ 179
PEG Ratio
2.15
Price to Sales
8.41
Debt
₹ 94.0 Cr.
Debt to equity
0.04
Int Coverage
80.8
Reserves
₹ 2,403 Cr.
Promoter holding
54.8 %
Pledged percentage
13.1 %
EPS last year
₹ 16.6
Net CF
₹ 10.6 Cr.
Price to Cash Flow
38.6
Free Cash Flow
₹ 750 Cr.
OPM last year
26.4 %
Return on assets
22.9 %
Industry PE
42.1
Sales growth
5.06 %


EMAMI TARGET 890 STOP LOSS 762Script good support taken and breakout weekly and daily from the resistance of 762 and good daily closing. Next target is 890

EMAMILTD- ATH BreakoutEMAMILTD has completed Breakout and Retest, now it has started trading in greenfield area.
If Market supports, it will continue to make Higher High.

Emami - breakout after almost 10 years of consolidation. Emami - breakout after almost 10 years of consolidation.

Emami Ltd monthly break out with volume 2016 to 2018 continue 2 years high zone is break in Last month and current month open is up side with high volume. A big side movement is possible now in this week.

Emami Ltd Swing Trade Opportunity with Potential Gains Up to 50%### Recommendation: Emami Ltd
- **Type of Trade**: Swing Trade
- **Entry Price**: Above 732.50
- **Short-term Stop Loss**: 690 (below 4-hour closing)
- **WCB Targets**: 800, 900, 1000, 1100
- **Long-term Stop Loss**: 600
**Fundamentals of Emami Ltd**:
Emami Ltd is a prominent player in the personal care and healthcare industry in India. The company has a diverse product portfolio, including well-known brands in skincare, hair care, and health products. Emami has demonstrated consistent financial performance, with strong revenue growth and profitability. The company has a solid market presence and is continuously expanding through innovative product launches and strategic acquisitions.
**Disclaimer**: I am not SEBI registered. Consult your financial advisor before making any investment decisions.
