EXIDEIND trade ideas

Exide Industries : H&S pattern on 15 min chart#EXIDEIND form the Head&Shoulder reversal pattern on 15 min chart. Level 160 is very strong resistance. If level 157.90 will break then stock can see pullback on level 156.65 and if face resistance from 157.90 then bottom target will be 153 while support on 152.35
----------------------------------------------------------
Support : 156.65 and 153
Breakdown : 157.90
LTP : 159.15
Breakout : 160.10
Long Target : 162 and 165
----------------------------------------------------------
(Disclaimer: This is only for educational purpose and paper treading. Learn and take advice from you financial advisor)

EXIDE INDUSTRY 170 CE at 1.6, Jul Month -BullishTeam, I have given call in my Telegram channal today about EXIDE INDUSTRY I AM seeing Exide is strong can go upto 170 Levels and risk of 6K hardly we can take Hero or Zero of EXIDEIND 170 CE for JULY SERIES at 1.6, Stop Loss 0


EXIDE 2020 ANALYSISBUY AT SAID LVL
BLACK DOTED LINE ACT AS SUPPORT AND RESISTANCE
ZOOM OUT ON CHART TO SEE THAT IT IS TRAVELLING IN A RANGE
PURPLE LVL WE CAN START BUYING A BIT QTY & ADD AS SAID LVL
IF GROSSED GREEN LVL & SUSTAIN
THE NEXT TARGT IS PURPLE LVL.


Continuation to the UpsideExide looks like it completed a running flat - a sideways move, after the initial upmove. I expect an upmove next, in the same direction of the first move. I see a low risk , high reward setup here. The initial upside target could be the "b" point of the flat and there is a good chance it can continue moving up after the initial target. Its a classic continuation pattern.
** This is not a trade advise**


Exide India - longExide india has rebounced back from its 20 DEMA and is currently taking support at its previous resistance. The stock has fallen on account of its results. It is best time to accumulate for 5 to 10% upside, possibly within this week.


Exide Industries Short setup By elliote +Price Action Breakout Hello friends, Price is becoming narrow in lower value expected to move toward gravity price within days.
you can take Short entry in Exide Industries !!
Thanks
If you want long term analysis then you can check the link below price is moving according to our level thanks!

Exide industries analysis by wave theory !!Hello friends its weekly chart of Exide Industries
Those who are like to buy a cheap share for their portfolio can look toward Exide industries, Buy Exide life between 130-140 with stop loss 112
for toward 171-190-220
Thank you


EXIDEIND may drag towards the big bull rally at this levels.EXIDEIND last time a big bull rally from this levels because demand is getting increasingly bullish on this counter now we can see In the short-term, the stock may try to bounce back. It finds immediate support at ₹167 and a crucial one at ₹163. A close below the latter could trigger another bout of selling that could drag EXIDEIND below the ₹150 level.


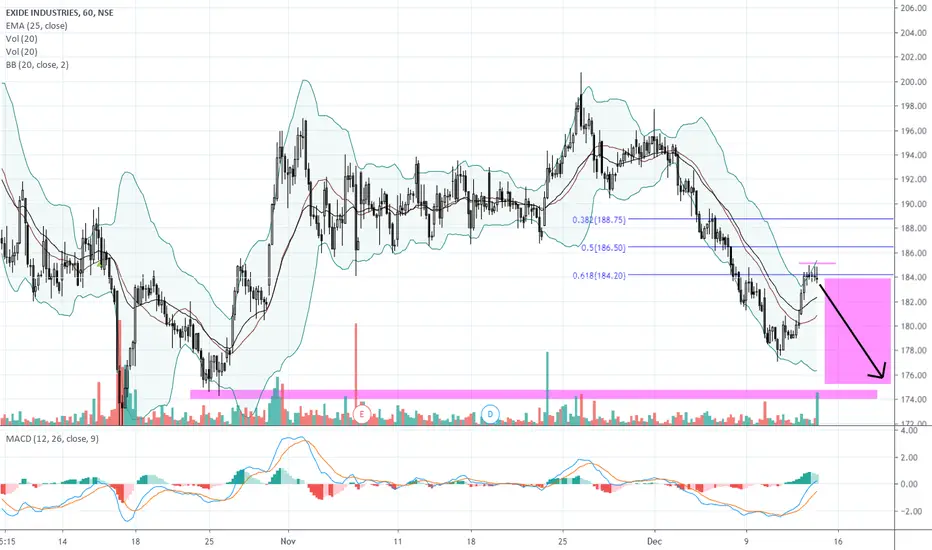
ExideWe can see in this setup that price is taking support at 50% Fibonacci level from previous high and also the price is trading above the two EMA channel, once it gives green shoot above Green line of EMA then one can go long or else if it goes below lower EMA line and breaches 38% Fibonacci line on the downside and gives a close there then go short


LONG POSITIONTRACK LIST EXIDE INDUSTRIES
BUY ABOVE- 195.05 (VALIDITY FOR 3 DAYS)
TARGET PRICE- 235
IF UNABLE TO BREAK 195.05 WHITHIN 3 DAYS LEAVE THIS STOCK AND WAIT

