FDC EXPECTED TO START BULL PHASE FDC STOCK COMPLETES Correction on 4 hours pattern expect to outperform markets....can go long for target 430 in next 6 months for sl 325Longby PNW_INVESTMENTSPublished 0
FDC breaking outFDC breaking out from falling wedge, 44SMA broke out taken support from 200 EMA Longby AsifHussain999Published 0
FDCFDC Neckline Breakout @ 317 Looks good to buy if sustain level above 317. Target 325, 330. Book Partial profit once achieve first target. SL 309 by ShareMarketWorriersUpdated 0
Good to go LongCup & Handle Pattern, for short term trade target Visible, 351- 371Longby vishwakamitPublished 110
FDC BREAKOUT ⬆️⬆️⬆️🔥🔥🔥🔥Fundamental Strong company FDC gave rectangle BREAKOUT Buy now@310 for short term target 410 or accumulate for long term.Longby anishkh0276Published 1
LONG ON FDC LTDNow stock at a good retest zone, we can wait for a HH formation in 1hr time frame before buying. Daily time frame showing RSI BULLISH DIVERGENCE.Longby CkswainPublished 221
#FDCA relatively riskier trade, but very attractive risk to reward ratio. It is currently testing its 2016 levels after giving a stellar breakout recently. I entered yesterday at 280, with stoploss below 260 and target as ATH.Longby Stock_SelectPublished 0
FDC on super bull runFDC is on a bull run after company's announcement of buyback @Rs.450/sh , the stock has shown massive growth technically respecting its narrowing upside wedge , the question now is that will it be able to give a breakout above its 5year divergent channel or will show resistance around 425 which has been indicated in my chart using trend lines NSE:FDCby namanmamania007Published 111
R-0104 Short term cash buy FDC @ 277-278 TK cross over ichimoku cloud break out MACD cross over TGT 295 SL 270 Longby brainmassfinancePublished 3
FDC breakout with volume - long @272 for 311 / 331 SL 254FDC breakout above Feb & Jan high with volume, closing at day high. There is resistance at 311, crossing above there could be big move. SL 254 Longby Jai_SadguruPublished 1
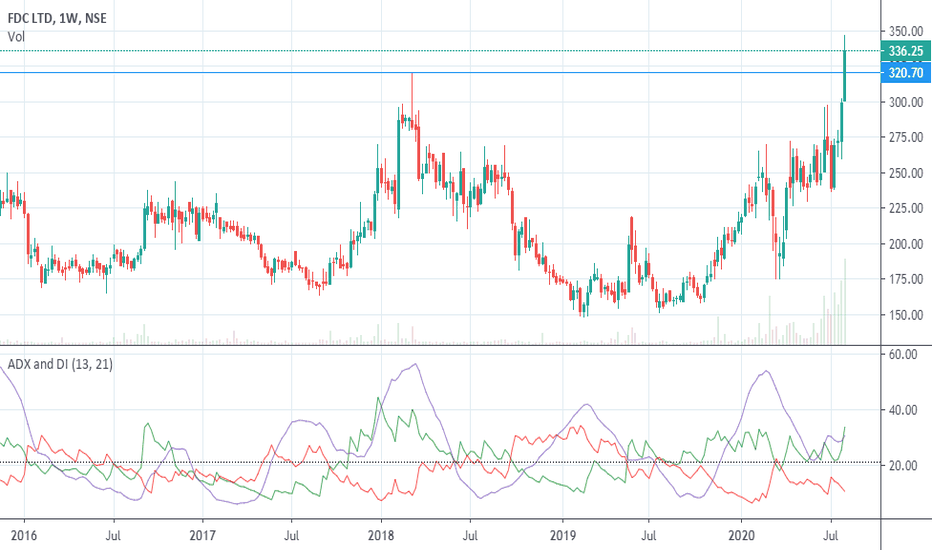
FDC - LOOKING VERY BULLISHFDC CMP 305 TARGET 360 PLUS STOP 275 Weekly chart 1) Stock has cleared previous reistance with huge volumes. 2) Stock has had a long consolidation W pattern spanning several months, the range of which has been convincingly broken out. 3) Stock has the potential to move towards 360 plus in the coming weeks time. Longby scorpiomanojPublished 1