FEDERALBNK trade ideas


Federal Intraday- PositionalGood Risk to Reward, bought at 94.Todays Close above 95 can be kept as positional 96,98.
SL 93


wait for long call of federalabank @65-70. to an target 125pluswait to buy federal bank @65 to 70 range for longterm & sure target is 125 plus..
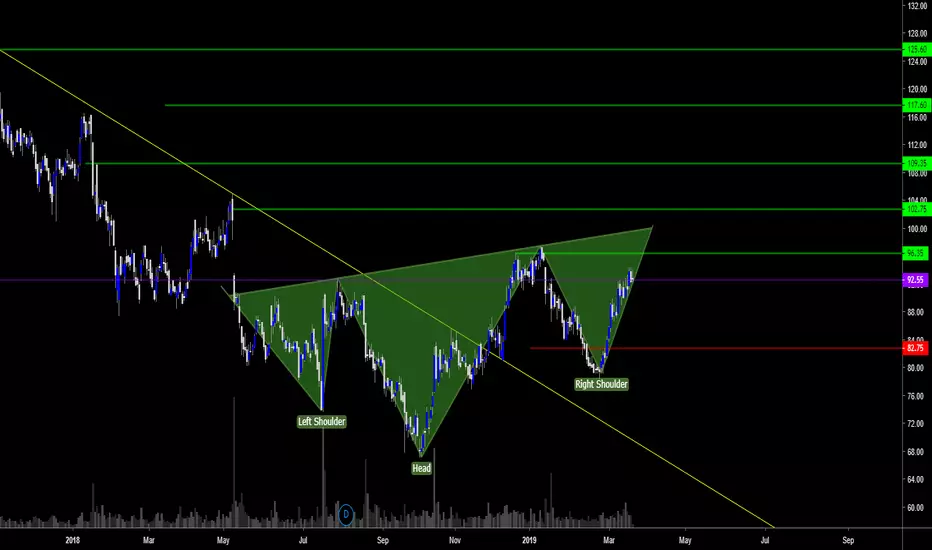
Head & shoulder visible...


Federal Bank: CYPHER Pattern on Daily ChartThe analysis is only for educational purpose.
CYPHER Pattern Rules
Point B retraces to 0.382 – 0.618 Fibonacci level of the leg XA Condition satisfied
Point C is formed when prices extend the XA leg by at least 1.272 or within 1.130 – 1.414 Fibonacci extension level Condition satisfied
Point D is formed when it retraces 0.782 Fibonacci level of XC - close to .782 Condition satisfied
Point D is also where prices are expected to reverse
RSI also supports the weakness in price.
Target : Targets are determined as 0.382 and 0.618 Fibonacci retracement levels of the CD leg
Ideally Stops losses are placed a below or above the high or low of point X.
T1 = Rs 84.5 can be achieved.

High Probability Trade - Federal BankIf the stock is able to stay above 21 WEMA, expecting it to go back to previous highs of 125. bounced from Support zone, breakout from Channel, now 21WEMA providing support. Look for long in this counter.

PRICE ACTION TRADING - learning perspectiveThis is based on the book by Laurentiu - Price action breakdown
Fair Value area - is the rectangle box -where price has spent most of the time trading at, an area where supply met demand.
The price area confined between those two horizontal lines in the chart above is the fair value area
Excess Price -
You can see that price has gone three times above the higher limit of value that I have drawn on the chart and three times below the lower limit. However,price did not spend much time in those areas, it just tested those levels, found demand on the downside, supply on the upside and quickly retraced back in the area where the bulk of trading was taking place. These areas where price deviates away from value for a short period of time only to come back inside it is excess price.The excess price you have seen in the above examples,can be interpreted in the following way.It reveals clear supply and demand zones. As a result, they will serve as strong support or resistance levels. It shows rejection of a price level.Observe how price behaves at the “1” area. It goes outside of what is perceived as value for price but it spends very little time there. It comes back down again which will consolidate the fair value area even more. The same thing happens at “2”, "3" and “4” area levels. This reveals the buyers and the sellers clearly entering the market as they consider these levels of price as advantageous for them.
Tail or spike -
look @ 4,& 6. Observe how price goes above value and spends there the least amount of time possible. This level is rejected very swiftly. The supply increased rapidly here. This is a clearly visible footprint of the sellers entering the market. The tail shows greater rejection of that price area.
I shall follow this article up tomorrow

NSE:FEDERALBNK Sell For 05 Dec 2018NSE:FEDERALBNK sell initiate for 05 Dec 2018 using 30 minutes chart based on Fibonacci levels,
check below Sell level :
Sell Below : 84
Stop Loss : 85.5
Target : 83

FEDERALBNK - Bullish Trend Expected to reach at 96.9 FEDERALBNK - Bullish Trend,
Monthly
- Previous bearish Trend
- Monthly Stop Loss 75.70
- It is downtrend for short time, right now it is at resistance level ~ 84.95
- The expected target is about 110 price
Weekly
- Downtrend channel of about 17 pips
- Expected to cross at 85, if weekly close is above 85 then it is BUY
- The next immediate target is at 105.5, with the strict stop loss @ 75.7
- Risk : 8.7, Rewards : 21.1 R:R => 2.42:1
- Ideally you shall wait to cross 85 on weekly chat and then enter
Daily :
- Previous uptrend
- Short descending triangle at 78 to 83.6
- The immediate target is ~96.9 with stop loss is at 84
- the R:R => 3:1
Resistance Levels
- 96.90
- 105.5
- 122.5
Weekly Pivot Points :
- 87.77
- 90.28
- 94.77

is it a Head & shoulder pattern in makingJust a Query ?
Can in be a Head and shoulder pattern in making

Analyzing the final descent in Federal bankFederal bank is at the final descent
details explained in the chart

ANALYZING THE FINAL DESCENT OF FEDERAL BANK IN HOURLY CHARTFEDERAL BANK IS IN THE FINAL DESCENT
it can be bought in multiple entry levels between 70 to 75
keep a stop loss of 60
target 140 in another 2 years


FederalBank Trading Idea(User Ondemand)Federal bank looks strong for long but still have to wait for lower timeframe confirmation once the consolidation overs(seller dies out followed by strong buyer comes / else HH & HL formation in lower timeframe near the support line marked as green.)

