FluoroChem ,1WFirst Triangle Pattern is Breaked Out and Next Channel Pattern is Formed at Retest for Triangle Pattern .
Now Channel Pattern is Ready to breakout , SO look an Eye on it when Breaking
Only Enter after the breakout of upper Trendline of Channel Pattern .
Be Careful when entering at breakout
Follow for more Swing Trade Ideas Like This
FLUOROCHEM trade ideas

Possible trendline BreakoutStock is near support levels and trying to maintain price near support.
Not falling in weak markets which shows Possible strength.
Can be a candidate for trendline breakout lets wait & watch

GUJARAT FLUOROCHEM LTD GIVE A BREAKOUT WITH BIG VOLUME...NSE:FLUOROCHEM trade at 3975 level. Stock give a breakout with big volume at 3800 level.
You can watch for an upside move at 4800-5000 level...

GUJARAT FLUOROCHEM LTD S/RSupport and Resistance Levels:
Support Levels: These are price points (green line/shade) where a downward trend may be halted due to a concentration of buying interest. Imagine them as a safety net where buyers step in, preventing further decline.
Resistance Levels: Conversely, resistance levels (red line/shade) are where upward trends might stall due to increased selling interest. They act like a ceiling where sellers come in to push prices down.
Breakouts:
Bullish Breakout: When the price moves above resistance, it often indicates strong buying interest and the potential for a continued uptrend. Traders may view this as a signal to buy or hold.
Bearish Breakout: When the price falls below support, it can signal strong selling interest and the potential for a continued downtrend. Traders might see this as a cue to sell or avoid buying.
MA Ribbon (EMA 20, EMA 50, EMA 100, EMA 200) :
Above EMA: If the stock price is above the EMA, it suggests a potential uptrend or bullish momentum.
Below EMA: If the stock price is below the EMA, it indicates a potential downtrend or bearish momentum.
Trendline: A trendline is a straight line drawn on a chart to represent the general direction of a data point set.
Uptrend Line: Drawn by connecting the lows in an upward trend. Indicates that the price is moving higher over time. Acts as a support level, where prices tend to bounce upward.
Downtrend Line: Drawn by connecting the highs in a downward trend. Indicates that the price is moving lower over time. It acts as a resistance level, where prices tend to drop.
Disclaimer:
I am not a SEBI registered. The information provided here is for learning purposes only and should not be interpreted as financial advice. Consider the broader market context and consult with a qualified financial advisor before making investment decisions.

FLUOROCH trendline breakout Trendline breakout. Watch out for a confirmation & go bullish. SL below the trendline.

gujarat flurochemGujarat Fluorochemicals Limited (GFL)'s growth drivers include:
Phasing out of destocking in Europe and exit of legacy players in the fluoropolymer segment: This is expected to lead to continuous quarter-on-quarter growth, with a particularly positive impact anticipated in FY25.
Significant investment in EV and ESS battery solutions (Rs. 6,000 crore over 3 years): This investment fuels the expansion of GFL's battery materials manufacturing capacity, targeting significant global opportunities in the EV and ESS ecosystems. This includes commissioning new plants dedicated to battery materials production.
Strategic alignment with market demands: GFL is focusing on providing high-quality, reliable battery materials to meet the growing demand in the EV sector, both domestically and globally. This includes a commitment to rigorous quality control at every stage of production.
Government initiatives supporting EV adoption in India: Policies like the Production Linked Incentive (PLI) scheme and state-level subsidies are creating a favorable environment for growth in the Indian EV market, which GFL is well-positioned to capitalize on.
Resilience of the Indian EV market: Despite global disruptions, the Indian EV market remains robust, driven by the two-wheeler and three-wheeler segments. This presents a significant opportunity for GFL's battery chemical offerings.
Diversification into battery chemicals: GFL's expertise in fluorine chemistry allows it to offer a range of battery chemicals (Cathode Active Materials, Electrolytes, Battery Binders, and Additives), catering to a broad spectrum of needs within the EV industry.
Innovation and collaboration: The establishment of a Performance Testing Lab (PTL) will foster innovation and collaboration with customers, enabling tailored material solutions. GFL also actively seeks partnerships to enhance its technology, quality, and overall solutions.
Commitment to sustainability: GFL's adherence to various environmental certifications and regulations enhances its reputation and attracts environmentally conscious customers. This is increasingly important in the EV sector.

GUJRAT FLUORODHEM LTDThese are swing ideas which you can add your watchlist and analysis for yourself !
Keep on your radar!
i am not sebi ragister!


Gujarat Fluorochemicals Ltd*Gujarat Fluorochemicals Ltd*
P&F Formation on Yearly Basis.
Strong Vol Consolidation & Continued Traction.
Price BreakOut>4025 needed to be watched.
If Sustained, Good to Go!!!
RSI: 1H>D>H>M. All in Bullish Zone.
EMAs: Widening Gaps amongst 20/ 50/ 100/ 200 levels on Weekly Basis.
*Trail SL with Upside*
*Book Profit as per Risk Appetite*
Stable Financial:
Improving Topline /Bottom line on Qtrly/TTM basis along with Profitability margins.
Moderate leverage, growing TNW.
Increasing FIIs/ DIIs Stakes continuously.
Concern: High WC & Contingent liabilities. Reduced Promoter's stake.
*This is an Opinion. Do your own research as well.*
*_Happy Investing_*🤓

Moving average cross overStock - Gujrat Fluoro chem.
ENTERY - 3385
SL - 3229
TARGET- 3853
#RISKMANAGE
IF 50K CAPITAL
Position size(no of share)
Investment of capital
MAX LOSS - 500
PROFIT ------(1500+)
RISK TO REWARD (1:3)

FluoroChem Long Trade Setup Fluorochem running from Extreme Liquidity Area
SO , there is a high chance prabablity that it will clear 3900 in few days

swing pick - go long - this stock is picked after market close based on delivery qty data.
- follow this stock for next 5 days , if entry not triggered with in 5 days , ignore pick
- if price crosses today's high , go long
- keep candle low as sl , for tgt keep 1:1.5 Risk Reward
FLUOROCH💪Strong Breakout Stock💪
These are swing ideas which you can add your watchlist and analysis for yourself !
Keep on your radar 📡
This content only education purpose!
❗I am not sebi ragister❗

Fluorochem Chart for studyGolden cross over
Trend line break
1st resistance break 3160
2nd resistance 3458
RSI Above 60 Daily / Weekly / Monthly
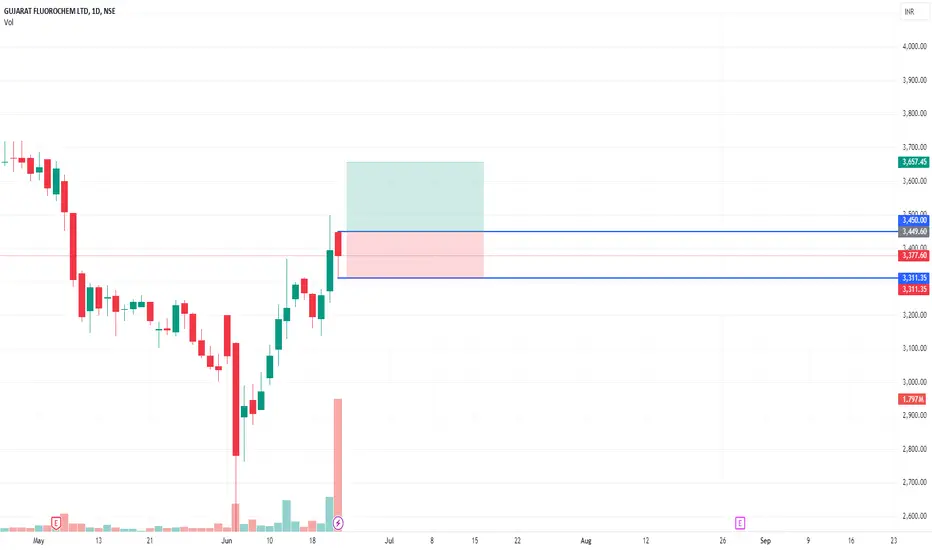
FLUOROCHEM : Booked a profit of about 22.41% on invested capitalPrice is close to the upper trendline of the channel. This may act as an inflection level and there is a high probability for the price to reverse from these levels. So decided to book profit which was about 22.41% on the invested capital.
Moreover, the entire Indian Market is over valued at the moment and there is a possibility for the whole market to turn bearish anytime soon. So I do think that it is better to book profits aggressively and maintain cash positions.
I'll consider a re-entry if price crashes and comes back to the low of the channel line.


FluorochemReverse from Major support Level
Cross 7 days Rsi by 28 days
below 2524
next support is 2111

Caution AheadStock has shown signs of weekness.
Currently trading close to long term support range.
IF it breaks below this range, it will trigger further selling.
Forming H&S
Time to be Cautious.

Fluorochem both side moveTake entry at 2755
Strong sl at 2699
Target 3245 and 3399
2nd move
Take entry at 2405
Target 3018Rs

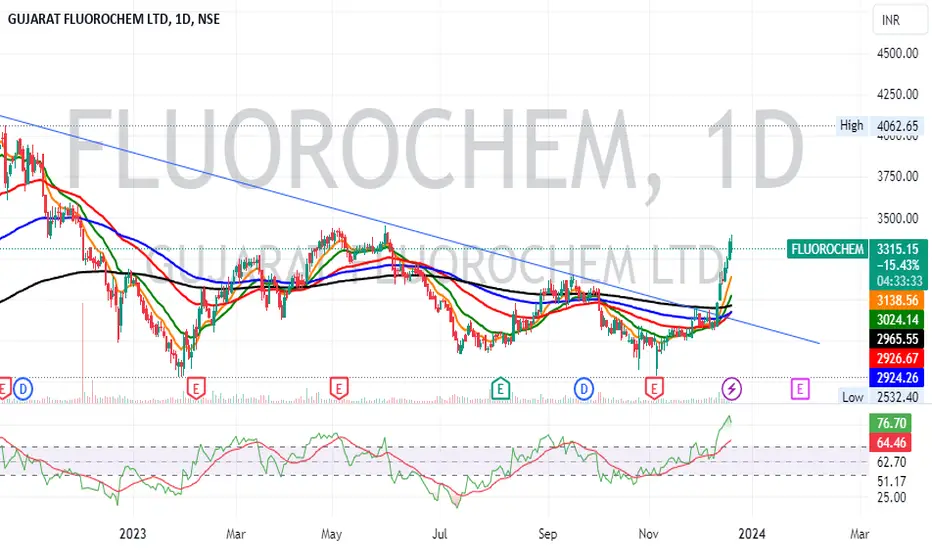
Gujarat Fluorochemicals: Symmetrical Triangle breakout CMP: 2916 | Industry: Chemicals
P/E: 26.3 | Industry P/E: 29.9|ROE: 13.7% | ROCE: 27.1% |BV: INR 503 | EPS: INR 111| MCAP: 32,033 Cr.
Aggressive Entry: 2,916 | Resistance Levels: 3,152 | 3,552| 4,076 Stop Loss: 2,680
Confirmation entry levels > 3,049 | CCI: -82 | EMA (9d): 2,793 | S. RSI: 25
Analysis: GFCL has been in the formation of a symmetrical triangle pattern since June 2022. It has rejected to break out from a declining trendline twice previously in Oct’22 and May’23. This time stock seems to be in strong momentum with rising volumes for 2 weeks consecutively. Momentum indicators are recovering from Oversold regions and with an uptick in direction too. If the stock closes above 3,049 entries can be taken for the nearest breakout levels of 3,152, 3,559 and the long-term target of 4,076. In case of pattern failure stop stands at close below 2,680.

ViewFormed Head and shoulders in weekly chart Bearish view based on Technical analysis
Better to add at 2200-2000 levels
