GICRE CMP 460.Last month i was made its new all time high with multi year breakout.460 level is its retest level and it respecting this level.Now on weekly time frame we can see a reversal candle.After budget full chance that this sector Perform in coming days.Add this to your wachlist.And see how it perform.
Next report date
—
Report period
—
EPS estimate
—
Revenue estimate
—
42.35 INR
74.32 B INR
497.99 B INR
308.83 M
About GENERAL INS CORP OF INDIA
Sector
Industry
CEO
Ramaswamy Narayanan
Website
Headquarters
Mumbai
Founded
1972
ISIN
INE481Y01014
FIGI
BBG00GKM2395
General Insurance Corporation of India engages in the provision of reinsurance services to the direct general insurance companies. It operates through the following segments: Accident and Health, Motor Third Party Liability, Motor Other Classes, Marine, Aviation and Transport, Fire and Other Damage to Property, Third Party Liability, Credit and Suretyship, Miscellaneous, and Reinsurance. The company was founded on November 22, 1972 and is headquartered in Mumbai, India.
Related stocks

GIC Monthly Chart, Accumulate on all Dips.
Long Term Investment
Stop Loss - 312
TGT - 2400
I am not SEBI Registered.

GICRE - Multi year breakoutDouble Digit ROCE and ROE
PEG Ratio < 1
Debt to Equity = 0
PE in buy zone
FII and DII stake increased.
Ideal buy from a long term perspective.

GENERAL INS CORP OF INDIA S/R Support and Resistance Levels:
Support Levels: These are price points (green line/shade) where a downward trend may be halted due to a concentration of buying interest. Imagine them as a safety net where buyers step in, preventing further decline.
Resistance Levels: Conversely, resistance levels (re
General Insurance Corporation - Clean Breakout on Monthly ChartLooks perfect to go long, one can buy in a staggered manner keeping in view of next one year

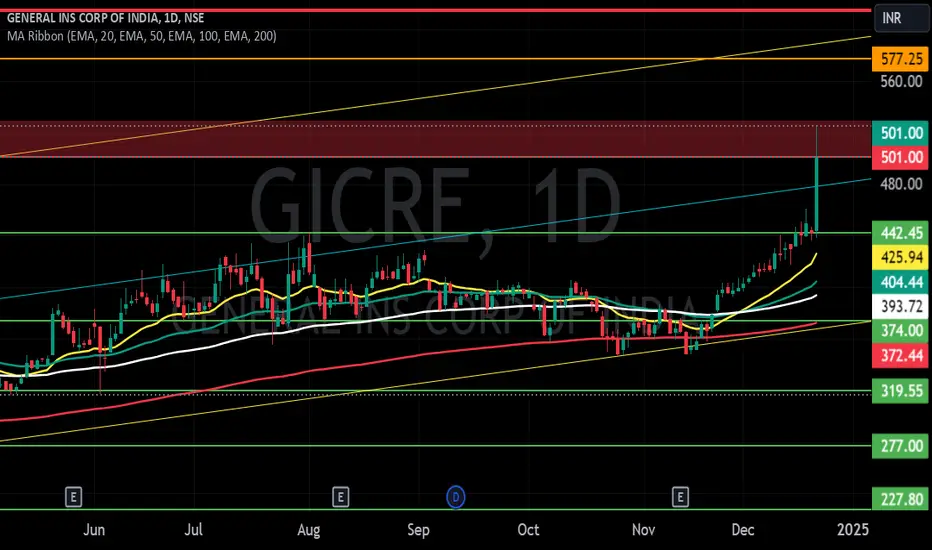
GICRE Weekly symmetrical triangle breakoutGICRE Weekly Symmetrical Triangle Breakout 🚀
Analysis:
GICRE has broken out of a symmetrical triangle pattern on the weekly chart, accompanied by a significant volume spike.
Breakout Level: ₹450
Current Price: ₹501 (+13.23%)
Volume: 53.43M (above the 8.01M average)
Key Levels:
Upside Targets:


GIC Re: Eyeing a Potential Breakout on the Weekly ChartThe stock of General Insurance Corporation of India (GIC Re) is exhibiting a promising technical setup as it consolidates near critical resistance. With strong price action and an ascending triangle pattern forming, the stage seems set for an upward breakout.
Key Levels and Setup
📈 Support Trendlin

Can General Insurance Corporation will touch 550?? As per Harmonic PRZ pattern, GICRE may upto T1, T2, T3 i.e. 477, 550, 656 respectively.

See all ideas
Summarizing what the indicators are suggesting.
Neutral
SellBuy
Strong sellStrong buy
Strong sellSellNeutralBuyStrong buy
Neutral
SellBuy
Strong sellStrong buy
Strong sellSellNeutralBuyStrong buy
Neutral
SellBuy
Strong sellStrong buy
Strong sellSellNeutralBuyStrong buy
An aggregate view of professional's ratings.
Neutral
SellBuy
Strong sellStrong buy
Strong sellSellNeutralBuyStrong buy
Neutral
SellBuy
Strong sellStrong buy
Strong sellSellNeutralBuyStrong buy
Neutral
SellBuy
Strong sellStrong buy
Strong sellSellNeutralBuyStrong buy
Displays a symbol's price movements over previous years to identify recurring trends.
Frequently Asked Questions
The current price of GICRE is 383.10 INR — it has decreased by −0.16% in the past 24 hours. Watch GENERAL INS CORP OF INDIA stock price performance more closely on the chart.
Depending on the exchange, the stock ticker may vary. For instance, on NSE exchange GENERAL INS CORP OF INDIA stocks are traded under the ticker GICRE.
GICRE stock has risen by 1.94% compared to the previous week, the month change is a 1.38% rise, over the last year GENERAL INS CORP OF INDIA has showed a −4.22% decrease.
We've gathered analysts' opinions on GENERAL INS CORP OF INDIA future price: according to them, GICRE price has a max estimate of 550.00 INR and a min estimate of 325.00 INR. Watch GICRE chart and read a more detailed GENERAL INS CORP OF INDIA stock forecast: see what analysts think of GENERAL INS CORP OF INDIA and suggest that you do with its stocks.
GICRE reached its all-time high on Dec 20, 2024 with the price of 525.50 INR, and its all-time low was 81.50 INR and was reached on Mar 25, 2020. View more price dynamics on GICRE chart.
See other stocks reaching their highest and lowest prices.
See other stocks reaching their highest and lowest prices.
GICRE stock is 3.07% volatile and has beta coefficient of 1.20. Track GENERAL INS CORP OF INDIA stock price on the chart and check out the list of the most volatile stocks — is GENERAL INS CORP OF INDIA there?
Today GENERAL INS CORP OF INDIA has the market capitalization of 671.94 B, it has increased by 4.27% over the last week.
Yes, you can track GENERAL INS CORP OF INDIA financials in yearly and quarterly reports right on TradingView.
GENERAL INS CORP OF INDIA is going to release the next earnings report on Aug 7, 2025. Keep track of upcoming events with our Earnings Calendar.
GICRE net income for the last quarter is 24.99 B INR, while the quarter before that showed 16.77 B INR of net income which accounts for 49.04% change. Track more GENERAL INS CORP OF INDIA financial stats to get the full picture.
Yes, GICRE dividends are paid annually. The last dividend per share was 10.00 INR. As of today, Dividend Yield (TTM)% is 2.61%. Tracking GENERAL INS CORP OF INDIA dividends might help you take more informed decisions.
GENERAL INS CORP OF INDIA dividend yield was 2.38% in 2024, and payout ratio reached 23.61%. The year before the numbers were 3.03% and 26.24% correspondingly. See high-dividend stocks and find more opportunities for your portfolio.
Like other stocks, GICRE shares are traded on stock exchanges, e.g. Nasdaq, Nyse, Euronext, and the easiest way to buy them is through an online stock broker. To do this, you need to open an account and follow a broker's procedures, then start trading. You can trade GENERAL INS CORP OF INDIA stock right from TradingView charts — choose your broker and connect to your account.
Investing in stocks requires a comprehensive research: you should carefully study all the available data, e.g. company's financials, related news, and its technical analysis. So GENERAL INS CORP OF INDIA technincal analysis shows the sell today, and its 1 week rating is neutral. Since market conditions are prone to changes, it's worth looking a bit further into the future — according to the 1 month rating GENERAL INS CORP OF INDIA stock shows the neutral signal. See more of GENERAL INS CORP OF INDIA technicals for a more comprehensive analysis.
If you're still not sure, try looking for inspiration in our curated watchlists.
If you're still not sure, try looking for inspiration in our curated watchlists.