Godfrey philipsGodfrey making a good structure, potentially cn mk a new high. Good positional set up.
GODFRYPHLP trade ideas

GODFRY PHILLIPS (GODFRYPHLP) BREAKOUT:Pattern Formation: Clear W-shaped double-bottom structure indicating a bullish reversal.
Breakout Confirmation: Price breaks above the neckline resistance with strong volume.
Retest Zone: Possible retest of breakout level before further upside.
Target Levels: Measure the height of the W and project it upwards for targets.
Stop-Loss: Below the neckline or recent swing low for risk management.

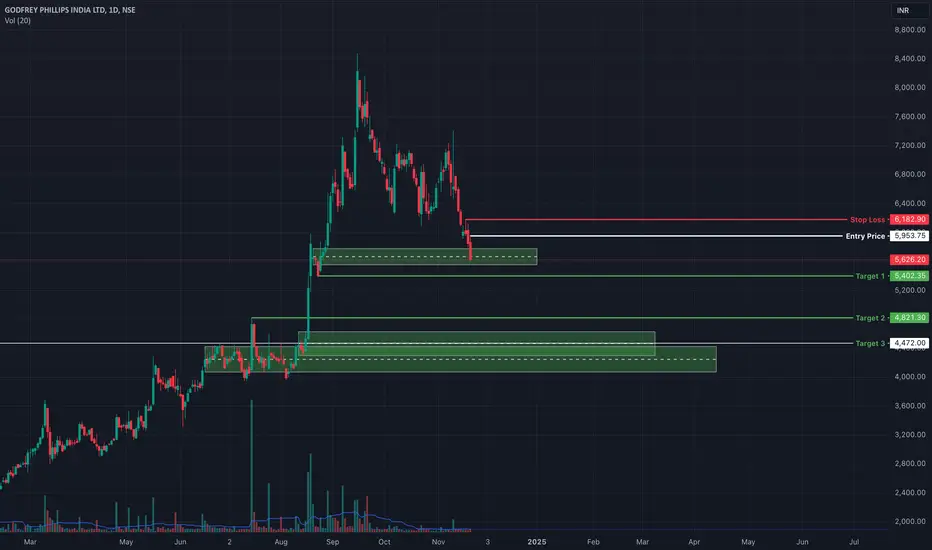
GODFRYPHLPwent up in good speed, might be retracing , any bullish sign on daily tf near trendline is good place to take it again

Godfrey Phillips India – Major Breakout in Progress! 📌 Technical Breakdown & Swing/Positional Trade Idea
Godfrey Phillips India is currently breaking out of a 150-day broadening pattern, signalling strong bullish intent with increasing volume participation. Let’s break it down:
Key Levels & Market Structure:
Monthly Resistance Breakout (Yellow Line): The price has convincingly broken above a key monthly closing resistance, marking a shift in trend.
Supply-to-Demand Zone Flip: A critical supply zone (marked in red) was breached and is now acting as an important demand area, where buyers are likely to step in for re-entries at better prices.
Broadening Structure: The stock has followed a classic expanding range (marked by white trendlines), showing volatility compression and breakout strength.
Weekly Counter-Trendline (CT): A hidden WTF resistance line (yellow) from the weekly timeframe was also taken out, adding further confluence to the move.
Cup & Handle Breakout (Cyan Zone): A recent cup & handle breakout with strong volume clusters confirms bullish momentum.
Trading at 50-Day High: The stock is now at a new short-term high, indicating sustained strength in price action.
Glossary (For Better Understanding):
Broadening Pattern: A technical formation where price swings increase in magnitude, forming an expanding structure.
Supply-Demand Flip: A price zone that initially acted as a supply (resistance) but later turned into a demand (support) after a breakout.
Counter-Trendline (CT): A hidden trendline that acts as a resistance within a prevailing trend, often creating liquidity traps.
WTF Hidden Resistance: A key level that isn't easily visible but plays a crucial role in price reactions.
Cup & Handle Breakout: A bullish continuation pattern indicating accumulation before a breakout.
Volume Clusters: Areas where heavy trading activity occurs, often signaling accumulation or distribution zones.
🚀 Conclusion: With multiple bullish confluences, volume backing, and a clean breakout, this trade setup presents a high-probability swing & positional opportunity. However, risk management remains key!
Let me know your thoughts in the comments! Are you tracking this setup?

Breakout Alert: GODFRY PHILLIPS🚀 Breakout Alert: GODFRY PHILLIPS 🚀
GODFRYPHLP has given a strong breakout, indicating bullish momentum. Keep this stock on your watchlist for potential upside movement.
🔹 Key Levels to Watch:
✅ Breakout Confirmation with strong volume
✅ Technical Strength supporting further upside
Stay tuned for further updates! 📊🔥

#GODFRYPHLP Price Action Update ---TheBarBellTrader📊 Price Action Update: GODFRYPHLP
TheBarBellTrader
🔍 Stock Analysis
Price from ATH: The stock is trending down from its All-Time High (ATH).
Key Observations:
Oct 22 & 23, 2024: Second Demand Zone (DZ) was broken, confirming a daily downtrend.
Post-October: WSZ action at the 125-minute time frame—a Lower Time Frame (LTF) zone worked, further pushing the price down.
November 11, 2024: The price fell sharply, losing -10%.
January 13, 2025: All Daily Supply Zones (DSZ) have worked; no Weekly Demand Zones (WDZ) were broken until the last trading session (LTS).
January 23, 2025: Price entered the August 12, 2024 WDZ and simultaneously re-entered a Monthly Demand Zone (MDZ). Interestingly, the WDZ coincides with the MDZ distal line, creating a confluence zone for potential reversal.
📈 Trade Plan
Long Entry Points:1️⃣ ₹4063–₹40652️⃣ ₹3985–₹3990
Average Entry Price: ₹4025–₹4030
Stop Loss: ₹3865–₹3869
Total SL: ₹150–₹165
Targets:
🎯 Target 1: ₹5100
🎯 Target 2: ₹5190–₹5200
Reward-to-Risk Ratio: 6:1
🚀 Strategy Insights:This trade setup shows a high potential for upside with a disciplined reward-to-risk ratio. Utilize precision entries and maintain strict risk management for optimal outcomes.
📌 Disclaimer: This analysis is for educational purposes. Always conduct thorough research or consult a financial advisor before investing.

Godrey Philips : ShortVery good setup here. It has made kind of double top in weekly time frame.
You can even short at current levels if you could optimize SL using swing high in hourly time frame. Even if it is not FnO it is good excercise to observe price with paper trade.
Godfry Very good breakout of the falling pattern and with that can take a trade and make a target of ath and keeping below support level as a SL as earning are on head


GODFREY PHILLIPSSupport and Resistance Levels: In technical analysis, support and resistance levels are significant price levels where buying or selling interest tends to be strong. They are identified based on previous price levels where the price has shown a tendency to reverse or find support.
Support levels are represented by the green line and green shade, indicating areas where buying interest may emerge to prevent further price decline.
Resistance levels are represented by the red line and red shade, indicating areas where selling pressure may arise to prevent further price increases. Traders often consider these levels as potential buying or selling opportunities.
Breakouts: Breakouts occur when the price convincingly moves above a resistance level (red shade) or below a support level (green shade). A bullish breakout above resistance suggests the potential for further price increases, while a bearish breakout below support suggests the potential for further price declines. Traders pay attention to these breakout signals as they may indicate the start of a new trend or significant price movement.
20 EMA: The yellow line denotes 20 EMA, to interpret the 20 EMA, you need to compare it with the prevailing stock price. If the stock price is below the 20 EMA, it signals a possible downtrend. But if the stock price is above the 20 EMA, it signals a possible uptrend.
Disclosure: I am not SEBI registered. The information provided here is for learning purposes only and should not be interpreted as financial advice. It is important to consult with a qualified financial advisor before making any investment decisions. Tweets neither advice nor endorsement.

NSE:GODFRYPHLP - 🚬 ➕🏪➕🍭 can it create a magicThis evergreen stock from the FMCG Sector listed in India is not just on the verge of a breakout after seven years but also building optionalities that can surprise us on the upside.
👍
✅ Weekly Closing close to 52-Week High
✅ Stock up close to 40% in the last couple of weeks
✅ Verge of the multi-year breakout
✅ FMCG sector
🤞~ Every green sector
🤞- Optionalities - Cloud kitchen (ready to eat)
🤞- Optionalities - Convenience store's growth
👎 💣
❎Promoter's credibility
❎ Sin Stocks
❎ Not in explosive growth
BSE:GODFRYPHLP


Godfrey Philipsenter @cmp with 10/20 quantities... any dip to marked levels is golden buying opportunity. manage positions accordingly. target is open and may see 5k mark.Positional stock..

GodfryphlpBuy abv 1408.
Target 1485, 1660, 1900.
Otherwise Buy at 1000rs range with the SL of 900rs.

GODFRYPHLPStock trading above 100 DMA as well as above 20℅ reverse from last 6 month Low ,
It's Bullish sing

GODFRYPHLP go long ifgot @ 2221.10
stop loss : 2034
target: 2574
NOT SEBI registered , do your own analysis before taking trades , this trade is only for educational purpose

Top level Life time High breaking life time High with hight valume so that give better returns in short duration
No recommendation for buy or sell


GODFRYPHAnyone watching GODFRYPH
?
CMP 2039.
Feels like if close above 2149 with above avg volume then it might be a super performer,


GODFREY PHILLIPS range break out GODFREY PHILLIPS price range break out after years - stock is rocketing and good buying is observed with substantiating volumes since it ran so much might consolidate a bit before further move ,, keep watching the stock for the opportunity to take entry

GODFRYPHLP - Has held in 625-1325 for 7 YearsUp from Apr'21 to Oct'21 met supply at 1325
Demand re-appeared at 925 in Feb'22
Plan -
to Purchase Breakout above 1350
or, rejection indications near 900
PB 2x
PE 15x
DE 0.13x
ROCE 17%
Div 2%

