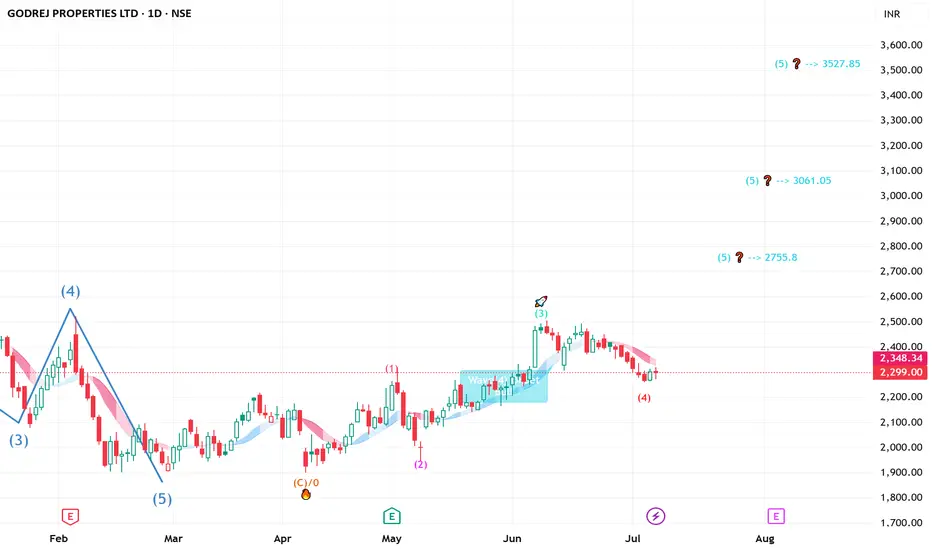
GODREJ PROPERTIES - Ready to FLY - short to long Elliot waveGODREJ PROPERTIES-----Daily counts indicate Excellent bullish wave structure.
Both appear to be optimistic and this stock invalidation number (S L) wave 2 low
target short / long term are already shared as per charts
correction wave leg seems completed
Investing in declines is a smart move for s
Next report date
—
Report period
—
EPS estimate
—
Revenue estimate
—
49.30 INR
14.00 B INR
49.23 B INR
125.55 M
About GODREJ PROPERTIES LTD
Sector
Industry
CEO
Gaurav Pandey
Website
Headquarters
Mumbai
Founded
1985
ISIN
INE484J01027
FIGI
BBG000PJ0ZC9
Godrej Properties Ltd. engages in the real estate construction, development, and other related activities in India, Singapore, Dubai, and the United States. It develops residential, commercial, and township projects. The company was founded on February 8, 1985 and is headquartered in Mumbai, India.
Related stocks
Godrej Properties - H&S Pattern to reach 1600Godrej Properties has confirmed Head & shoulder pattern breakdown.
With this breakdown, following targets possible.
2000 / 1885/ 1750 / 1600
SL: 2470

GODREJ Properties: Rallied quite well from a Buy Signal GODREJ Properties: Rallied quite well from a Buy Signal .
Important levels to test are 2522 /3000 .
( Not a Buy / Sell Recommendation
Do your own due diligence ,Market is subject to risks, This is my own view and for learning only .)
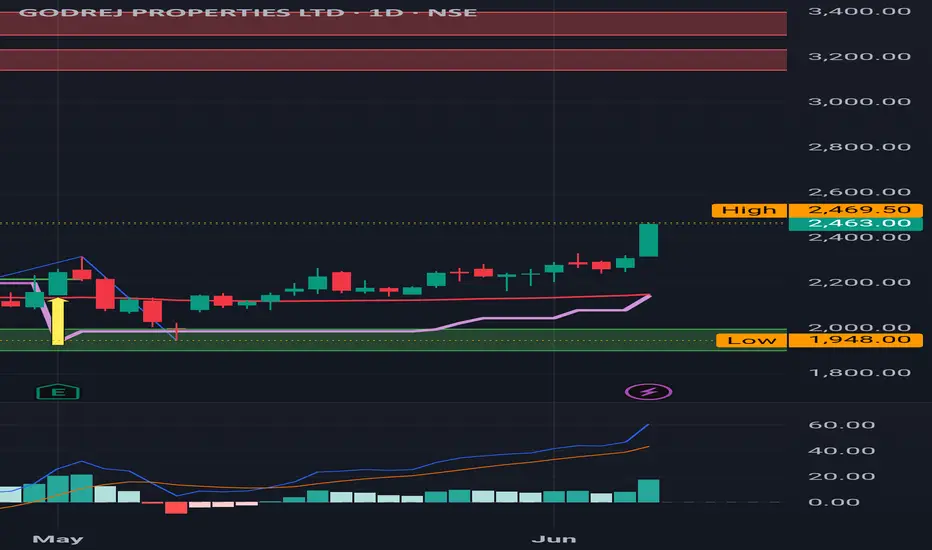
GODREJ PROPERTIES SWING TRADESWING TRADE SETUP
It is coming out of the accumulation zone and rectangle pattern breakout.
Buy above 2312
Target 2657
Stop Loss 1915

GODREJ PRO - LONGNSE:GODREJPROP Year with effect of Mars and in numerology also 2025 is the year for Mars- reflect the good momentum in realty sector. Also weekly chart showing buyers at location.

Godrej properties: Still maintaining a Buy Godrej properties: Still maintaining a Buy
Even though went all the way down to 1948 ,it didn't turn into a sell and got picked up from there.
( Not a Buy / Sell Recommendation
Do your own due diligence ,Market is subject to risks, This is my own view and for learning only .)

Godrej properties As per the weekly Timeframe and 200 Ema+ Dma support and Fibonacci retracement and we can see reversal towards upwards.

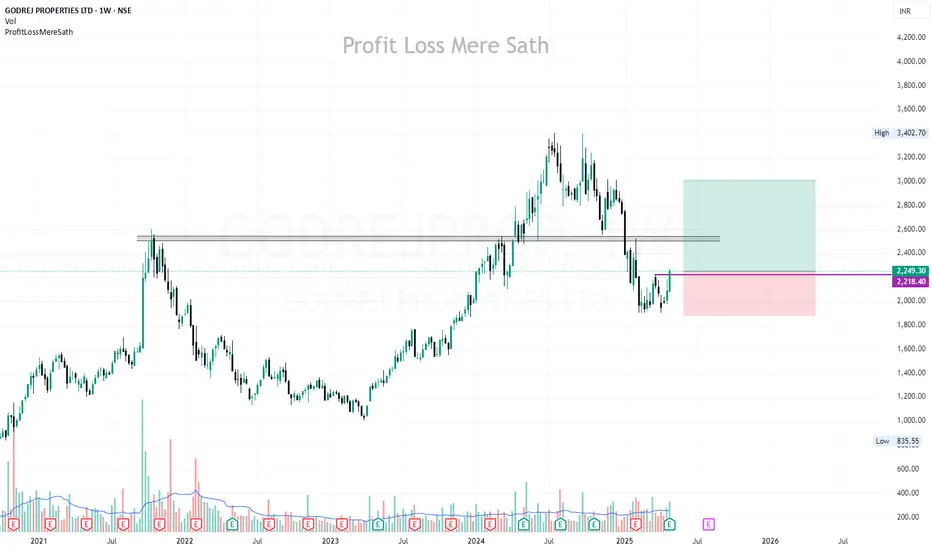
GODREJPROP | Buy @LTP | SL below 1870 | 1st Target 3000Disclaimer:
This is not financial advice. Please do your own research or consult with a financial advisor before making any investment decisions. Investments in stocks can be risky and may result in loss of capital.
Godrej properties: Buy triggered Godrej properties: Buy triggered
Nearby resistance at 2522.
Still under 200 SMA which is an important milestone to be watched out for.
( Not a Buy / Sell Recommendation
Do your own due diligence ,Market is subject to risks, This is my own view and for learning only .)

Equity Research Report – NEWGEN SOFTWARE TECHNOLOGIES Short-Term View: A strong breakout above key resistance at ₹1,100 with volume surge indicates bullish momentum. Price reclaimed the 50 EMA after consolidation. RSI at 60.87 supports strength; next resistance lies near ₹1,193.90.
Long-Term View: Structurally strong after correction. Sustaining above

See all ideas
Summarizing what the indicators are suggesting.
Neutral
SellBuy
Strong sellStrong buy
Strong sellSellNeutralBuyStrong buy
Neutral
SellBuy
Strong sellStrong buy
Strong sellSellNeutralBuyStrong buy
Neutral
SellBuy
Strong sellStrong buy
Strong sellSellNeutralBuyStrong buy
An aggregate view of professional's ratings.
Neutral
SellBuy
Strong sellStrong buy
Strong sellSellNeutralBuyStrong buy
Neutral
SellBuy
Strong sellStrong buy
Strong sellSellNeutralBuyStrong buy
Neutral
SellBuy
Strong sellStrong buy
Strong sellSellNeutralBuyStrong buy
Displays a symbol's price movements over previous years to identify recurring trends.
855GPL29
GPL-8.55%-26-7-29-PVTYield to maturity
8.04%
Maturity date
Jul 26, 2029
815GPL26
GPL-8.15%-03-7-26-PVTYield to maturity
—
Maturity date
Jul 3, 2026
840GPL28
GPL-8.40%-25-1-28-PVTYield to maturity
—
Maturity date
Jan 25, 2028
825GPL28
GPL-8.25%-03-7-28-PVTYield to maturity
—
Maturity date
Jul 3, 2028
85GPL29
GPL-8.5%-10-9-29-PVTYield to maturity
—
Maturity date
Sep 10, 2029
See all GODREJPROP bonds
Frequently Asked Questions
The current price of GODREJPROP is 2,233.80 INR — it has decreased by −3.41% in the past 24 hours. Watch GODREJ PROPERTIES LTD stock price performance more closely on the chart.
Depending on the exchange, the stock ticker may vary. For instance, on NSE exchange GODREJ PROPERTIES LTD stocks are traded under the ticker GODREJPROP.
GODREJPROP stock has fallen by −4.94% compared to the previous week, the month change is a −7.66% fall, over the last year GODREJ PROPERTIES LTD has showed a −27.94% decrease.
We've gathered analysts' opinions on GODREJ PROPERTIES LTD future price: according to them, GODREJPROP price has a max estimate of 3,580.00 INR and a min estimate of 1,800.00 INR. Watch GODREJPROP chart and read a more detailed GODREJ PROPERTIES LTD stock forecast: see what analysts think of GODREJ PROPERTIES LTD and suggest that you do with its stocks.
GODREJPROP reached its all-time high on Jul 16, 2024 with the price of 3,402.70 INR, and its all-time low was 154.00 INR and was reached on Jan 30, 2014. View more price dynamics on GODREJPROP chart.
See other stocks reaching their highest and lowest prices.
See other stocks reaching their highest and lowest prices.
GODREJPROP stock is 3.91% volatile and has beta coefficient of 1.74. Track GODREJ PROPERTIES LTD stock price on the chart and check out the list of the most volatile stocks — is GODREJ PROPERTIES LTD there?
Today GODREJ PROPERTIES LTD has the market capitalization of 672.95 B, it has increased by 1.53% over the last week.
Yes, you can track GODREJ PROPERTIES LTD financials in yearly and quarterly reports right on TradingView.
GODREJ PROPERTIES LTD is going to release the next earnings report on Aug 1, 2025. Keep track of upcoming events with our Earnings Calendar.
GODREJPROP earnings for the last quarter are 12.70 INR per share, whereas the estimation was 0.06 INR resulting in a 21.07 K% surprise. The estimated earnings for the next quarter are 12.89 INR per share. See more details about GODREJ PROPERTIES LTD earnings.
GODREJ PROPERTIES LTD revenue for the last quarter amounts to 21.22 B INR, despite the estimated figure of 15.26 B INR. In the next quarter, revenue is expected to reach 14.06 B INR.
GODREJPROP net income for the last quarter is 3.82 B INR, while the quarter before that showed 1.63 B INR of net income which accounts for 134.87% change. Track more GODREJ PROPERTIES LTD financial stats to get the full picture.
No, GODREJPROP doesn't pay any dividends to its shareholders. But don't worry, we've prepared a list of high-dividend stocks for you.
As of Jul 26, 2025, the company has 6.03 K employees. See our rating of the largest employees — is GODREJ PROPERTIES LTD on this list?
EBITDA measures a company's operating performance, its growth signifies an improvement in the efficiency of a company. GODREJ PROPERTIES LTD EBITDA is 20.42 B INR, and current EBITDA margin is 1.21%. See more stats in GODREJ PROPERTIES LTD financial statements.
Like other stocks, GODREJPROP shares are traded on stock exchanges, e.g. Nasdaq, Nyse, Euronext, and the easiest way to buy them is through an online stock broker. To do this, you need to open an account and follow a broker's procedures, then start trading. You can trade GODREJ PROPERTIES LTD stock right from TradingView charts — choose your broker and connect to your account.
Investing in stocks requires a comprehensive research: you should carefully study all the available data, e.g. company's financials, related news, and its technical analysis. So GODREJ PROPERTIES LTD technincal analysis shows the strong sell today, and its 1 week rating is sell. Since market conditions are prone to changes, it's worth looking a bit further into the future — according to the 1 month rating GODREJ PROPERTIES LTD stock shows the neutral signal. See more of GODREJ PROPERTIES LTD technicals for a more comprehensive analysis.
If you're still not sure, try looking for inspiration in our curated watchlists.
If you're still not sure, try looking for inspiration in our curated watchlists.