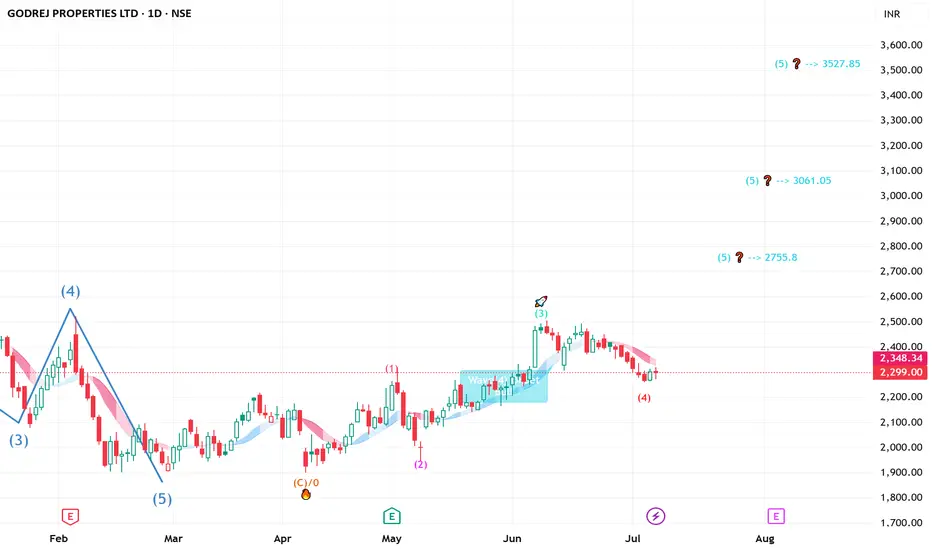
GODREJ PROPERTIES - Ready to FLY - short to long Elliot waveGODREJ PROPERTIES-----Daily counts indicate Excellent bullish wave structure.
Both appear to be optimistic and this stock invalidation number (S L) wave 2 low
target short / long term are already shared as per charts
correction wave leg seems completed
Investing in declines is a smart move for short/ long-term players.
Buy in DIPS recommended
Long-term investors prepare for strong returns over the next two to five years.
one of best counter
Every graphic used to comprehend & LEARN & understand the theory of Elliot waves, Harmonic waves, Gann Theory, and Time theory
Every chart is for educational purposes.
We have no accountability for your profit or loss.
GODREJPROP trade ideas
Godrej Properties - H&S Pattern to reach 1600Godrej Properties has confirmed Head & shoulder pattern breakdown.
With this breakdown, following targets possible.
2000 / 1885/ 1750 / 1600
SL: 2470

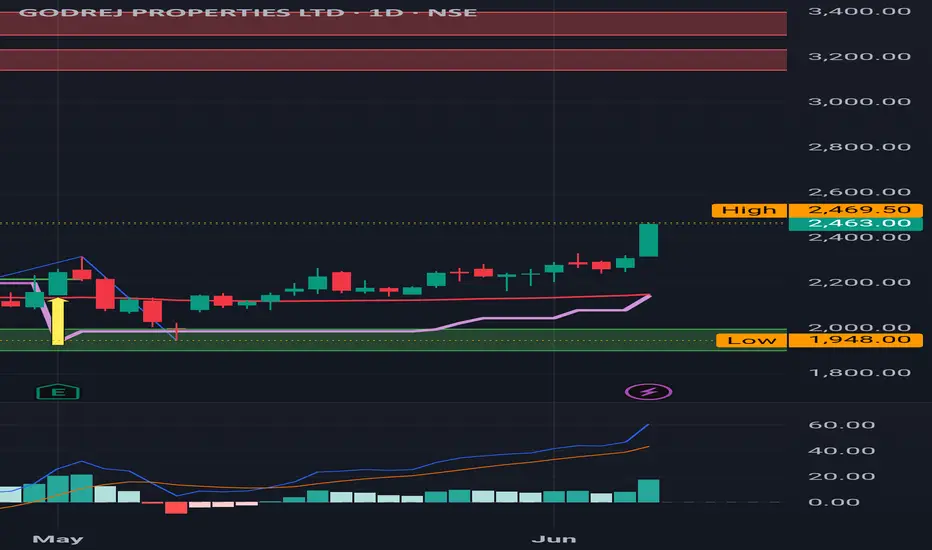
GODREJ Properties: Rallied quite well from a Buy Signal GODREJ Properties: Rallied quite well from a Buy Signal .
Important levels to test are 2522 /3000 .
( Not a Buy / Sell Recommendation
Do your own due diligence ,Market is subject to risks, This is my own view and for learning only .)
GODREJ PROPERTIES SWING TRADESWING TRADE SETUP
It is coming out of the accumulation zone and rectangle pattern breakout.
Buy above 2312
Target 2657
Stop Loss 1915

GODREJ PRO - LONGNSE:GODREJPROP Year with effect of Mars and in numerology also 2025 is the year for Mars- reflect the good momentum in realty sector. Also weekly chart showing buyers at location.

Godrej properties: Still maintaining a Buy Godrej properties: Still maintaining a Buy
Even though went all the way down to 1948 ,it didn't turn into a sell and got picked up from there.
( Not a Buy / Sell Recommendation
Do your own due diligence ,Market is subject to risks, This is my own view and for learning only .)

Godrej properties As per the weekly Timeframe and 200 Ema+ Dma support and Fibonacci retracement and we can see reversal towards upwards.

GODREJPROP | Buy @LTP | SL below 1870 | 1st Target 3000Disclaimer:
This is not financial advice. Please do your own research or consult with a financial advisor before making any investment decisions. Investments in stocks can be risky and may result in loss of capital.
Godrej properties: Buy triggered Godrej properties: Buy triggered
Nearby resistance at 2522.
Still under 200 SMA which is an important milestone to be watched out for.
( Not a Buy / Sell Recommendation
Do your own due diligence ,Market is subject to risks, This is my own view and for learning only .)

Equity Research Report – NEWGEN SOFTWARE TECHNOLOGIES Short-Term View: A strong breakout above key resistance at ₹1,100 with volume surge indicates bullish momentum. Price reclaimed the 50 EMA after consolidation. RSI at 60.87 supports strength; next resistance lies near ₹1,193.90.
Long-Term View: Structurally strong after correction. Sustaining above ₹1,020 (50 EMA) may attract fresh buying. Long-term targets can stretch to ₹1,300+ if earnings and demand trends remain favorable.
Conclusion: Bullish momentum likely to continue both short and long term. Watch for volume confirmation and hold above ₹1,100.
For Education Purpose only

Godrejprop bullishgodrejprop is showing bullish upcoming weeks and mostly broker change their aspects from hold to buy the target of 2515 so additional confirmation. this is only for education purpose

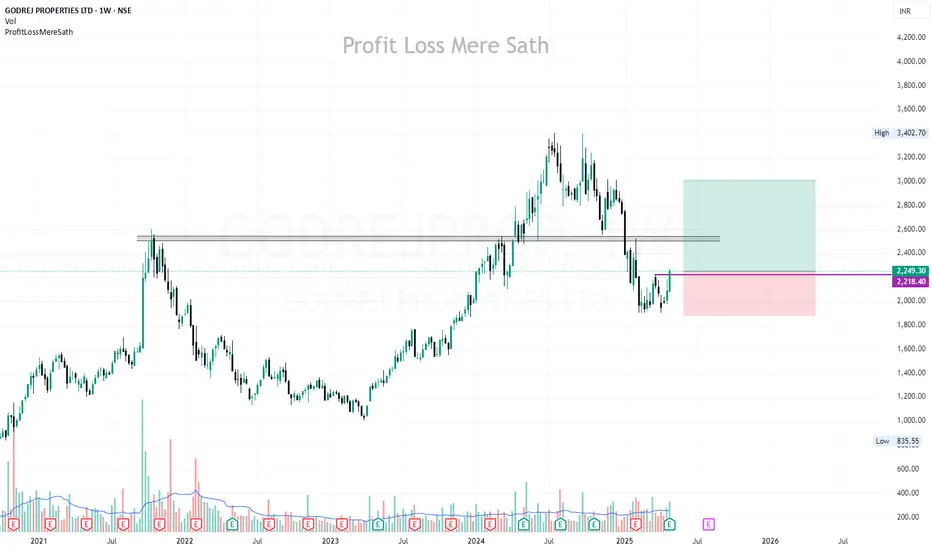
Reversal in Godrej Properties.On monthly Time frame, Godrej Properties is taking support at golden zone of Fibonacci retracement. Weekly closing above 2203 will the entry and closing below 1950 will be the SL. Expecting new high in coming months.
Please note: This a Monthly setup so it will be long term Investment. Will keep on adding quantity and weekly basis.

Godrej properties
2218 above positive
2185 below nigetive
80% my positive veiw
Only education purpose

Godrej properties Godrej properties trading very importent zone .. it can reverse from the marked level ..

47% GROWTH》GODREJPROP SHOWING A GOOD REVERSAL SIGN FROM BOTTOMRecently NSE:GODREJPROP almost drawdown 19% from recent high and we plan for almost 47% upward potentially reward.
🔔 NOTE:
➡️ ENTRY ONLY IF the weekly candle CLOSES ABOVE 2550 INR.
📊 Godrej Properties (GODREJPROP) is exhibiting a positive reversal from its bottom levels. However, ⚠️ signs of weakness remain visible.
✅ Suggestion:
Wait for a strong confirmation with the weekly close above 2550 INR to enter.
Once confirmed, bullish momentum could target long-term profits at the 3802 INR level.
🎯 TARGET LEVELS
TP-1 🟡: 2836.25 INR
TP-2 🟠: 3026.00 INR
TP-3 🟢: 3405.90 INR (50% Profit Booking Recommended Due to Resistance ⚒️)
TP-4 🟩: 3802.00 INR (Long-Term Target – 9 to 12 Months 🚀)
📉 STRICT STOP LOSS (SL):
2240.90 INR 🚫 (Ensure proper risk management here!)
⚡ Action Plan:
If entry conditions are met, follow the targets and risk levels carefully. This stock offers an excellent reward-to-risk ratio, but confirmation is key! 🕒
🔴DISCLAIMER:
I AM NOT A SEBI-REGISTERED ANALYST. SECURITIES AND INVESTMENTS ARE SUBJECT TO MARKET RISKS. PLEASE READ AND UNDERSTAND THE TRADING IDEA CAREFULLY BEFORE MAKING ANY INVESTMENT DECISIONS. INVEST WISELY AND AT YOUR OWN RISK. 📉📈
If you find this really helpful
Like,share,subscribe @Alpha_strike_trader

GODREJPROP Trading Within Fresh Demand ZoneGODREJPROP is currently trading at ₹2734.1, positioned within its fresh demand zone between ₹2737.35 and ₹2641.5, established on 22nd November 2024. This untested zone indicates potential buying interest, making it a level to watch for signs of support and possible trading opportunities.
Disclaimer: This analysis is for informational purposes only and should not be considered as financial advice. Please conduct your own research or consult a financial advisor before making any investment or trading decisions.

Take a loook at Godrej properties Take a loook at Godrej properties its following pull back strategy
taking support on bottom trendline and making higher highs
Target could be 3000, 3200 (upto 15%)
SL 3%
Thisi strictly for educational purpose

vcp pattern on daily time frame after upward rallyGodrej Properties trading above previous all time level and consolidating in range currently at lower part of range . it has formed vcp pattern or a triangular pattern after a up move. It has got very good chance of moving up to upper part of range

GodrejProp- Ulat Reversal Mode - 3 months Buy Now Buy TightGodrejProp- Ulat Reversal Mode - 3 months Buy Now Buy Tight
1) Mast Multibagger Breakout type pattern
2) Higher high , volume dec
3) May break the Zone with Full force


GODREJ PROPERTIES LTD S/R Support and Resistance Levels:
Support Levels: These are price points (green line/shade) where a downward trend may be halted due to a concentration of buying interest. Imagine them as a safety net where buyers step in, preventing further decline.
Resistance Levels: Conversely, resistance levels (red line/shade) are where upward trends might stall due to increased selling interest. They act like a ceiling where sellers come in to push prices down.
Breakouts:
Bullish Breakout: When the price moves above resistance, it often indicates strong buying interest and the potential for a continued uptrend. Traders may view this as a signal to buy or hold.
Bearish Breakout: When the price falls below support, it can signal strong selling interest and the potential for a continued downtrend. Traders might see this as a cue to sell or avoid buying.
20 EMA (Exponential Moving Average):
Above 20 EMA(50 EMA): If the stock price is above the 20 EMA, it suggests a potential uptrend or bullish momentum.
Below 20 EMA: If the stock price is below the 20 EMA, it indicates a potential downtrend or bearish momentum.
Trendline: A trendline is a straight line drawn on a chart to represent the general direction of a data point set.
Uptrend Line: Drawn by connecting the lows in an upward trend. Indicates that the price is moving higher over time. Acts as a support level, where prices tend to bounce upward.
Downtrend Line: Drawn by connecting the highs in a downward trend. Indicates that the price is moving lower over time. It acts as a resistance level, where prices tend to drop.
RSI: RSI readings greater than the 70 level are overbought territory, and RSI readings lower than the 30 level are considered oversold territory.
Combining RSI with Support and Resistance:
Support Level: This is a price level where a stock tends to find buying interest, preventing it from falling further. If RSI is showing an oversold condition (below 30) and the price is near or at a strong support level, it could be a good buy signal.
Resistance Level: This is a price level where a stock tends to find selling interest, preventing it from rising further. If RSI is showing an overbought condition (above 70) and the price is near or at a strong resistance level, it could be a signal to sell or short the asset.
Disclaimer:
I am not a SEBI registered. The information provided here is for learning purposes only and should not be interpreted as financial advice. Consider the broader market context and consult with a qualified financial advisor before making investment decisions.

F&O - Godrej Properties- 1.5+ Month Base #BreakoutStock
- Falling trendline #Breakout
- Volume Buildup
📌 Potential upside #stock ❣️&🔄

GODREJPROPHi guys,
In this chart i Found a Demand Zone in GODREJPROP CHART for Positional entry,
Observed these Levels based on price action and Demand & Supply.
*Don't Take any trades based on this Picture.
... because this chart is for educational purpose only not for Buy or Sell Recommendation..
Thank you
