Godrej Properties-Nice BreakoutGodrej Properties-Nice Breakout
Capital to be deployed- 20k
Investing Price -1730-1740
Breakout Price -1710
Stoploss -1455
Targets -2182-2640
Do retweet so that it helps someone
#godrej #StocksInFocus #StocksToBuy #stockstowatch #StocksInNews #SwingTrading #BREAKOUTSTOCKS
GODREJPROP trade ideas

Mid term trade opportunity On quarterly chart, there is a breakout and retest pattern with a strong bullish candle. Entry @1595.3 with SL @1312.15. Continuous bullish quarters can be expected here. Trail SL to every quarter low till exit.

#Godrejprop cash : Looks good above 1521.10#Godrejprop cash - Positional call
25.06.2023
Looks good above 1521.10
Stoploss 1495
Target 1556-1560/1590
Cmp 1499.45

Long Trade in Godrej PropertiesEnter after breaking the red trend with strong buying volume only, The trend is good and the price has been respecting the trend for almost a year.
This trade will give you around 30% profit so you have to be patient.
All the best to all my fellow investors,,

Inverted H&s Pattern in makingKeep Godrej prop in watchlist
any closing above neckline
can give 15-30 % upside move


GODREJPROP AT MONTHLY 40 SUPPORT #GODREJPROP down 60% from all-time highs & testing the confluence of supports! Price retesting horizontal breakout + primary trendline support since 2014. Monthly RSI @40 Support which indicates Value Buying in stock. Good For Investment Point of view. On Weekly + Monthly TF Price formed a falling wedge Patten and price also very close to upper downward trendline .After Breakout Good move can be seen in coming days. Wait for a higher high on daily before going with a full position. Price might consolidate for a few more weeks. Chart Showing perfect low Risk & High Reward Setup. Find Perfect Entry in Lower Timeframes. Positional Targets:- 1200/1355/1500+✔️

Godrej Properties NSE:GODREJPROP
Entry at current market price -
Gains: 15%
Duration: 3 months
If the price comes down to green box, it's a perfect buy zone.
Entry at green box -
Gains: 27-30%
Duration: 4 months
*Not a financial advice.
My charts speaks louder than words.
I'm a chartist and I paint charts.

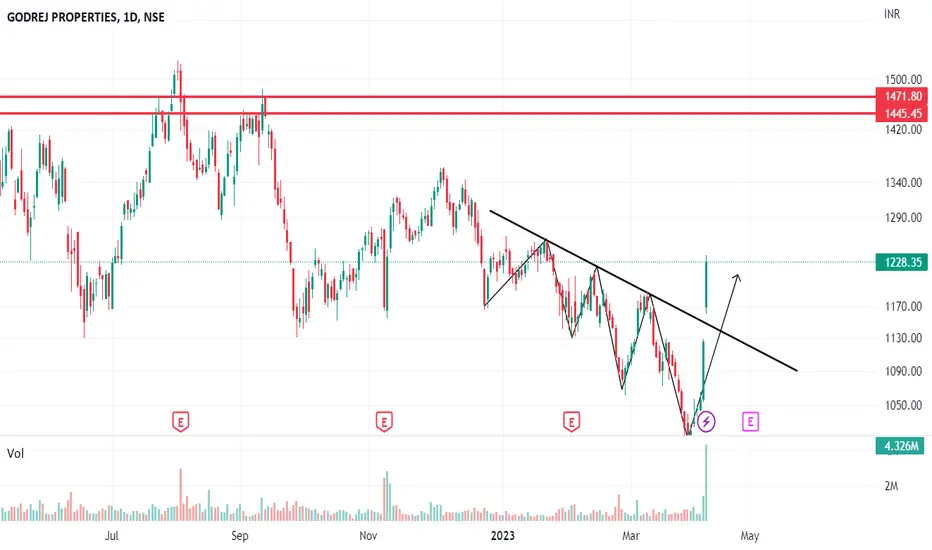
LH (Lower High) - LL (Lower Low) BreakoutPlease look into the chart for a detailed understanding.
Consider these for short-term & swing trades with 2% profit.
For BTST trades consider booking
target for 1% - 2%
For long-term trades look out for resistance drawn above closing.
Please consider these ideas for educational purpose
GODREJPROP - Weekly AnalysisIn the Weekly Chart of GODREJPROP ,
we can see that, Bullish pattern is formed.
Let it retest then enter with SL.

GODREJPROP Daily TF Sellers Trapped
GodrejProp on daily chart gave fake breakdown 2 times of major support to attract sellers.. Now after getting trapped, all their stoplosses will get hit as soon as it gives a breakout of previous swing high or W pattern neckline. Taking it 1700 levels in coming time. It can be a good option to invest for 3-4 months.

GODREJPROP SUPPORT BREAKDOWN!!!Hello to everyone,
👉👉Keep Eyes on #GODREJPROP ✅🎯
👉Strong Support Zone broken Today. If Price closes below the Support Zone on #Weekly Chart and price sustain itself below the Support level than we can see good fall in price in coming days.
👉 After Breakdown of support zone wait for the closing and let sustain the price below it than only enter in the position. ✅✅👍
Traders, if you liked this idea or if you have your own opinion about it, write in the comments. I will be glad.

GODREJPROP broke support lineSupport line is broken, for long term we can wait till weekend to confirm and short it for a good target

GODREJPROP sell for intraday tradingGODREJPROP sell for intraday trading if stock break the given support level........

Godrejproperties view for today 13th FebGodrejproperties view for today 13th Feb
Inverse head and shoulder expectation
Please follow strict risk reward and stop loss
Charts for educational purposes only
Thanks,
V Trade Point


STOCK NAME { GODREJ PROPERTIES } SWING TRADEperfect symmetrical triangle short term opportunity for upside take trade after breakout from the trendline according to own risk this is not call just a analysis..

GODREJ PROPERTIESBullish Engulfing on Daily TF.
Hoping for a breakout from the trendline to reach towards the target zones marked with red lines.

Short term pullback to 1590 on GODREJCPAppears near support zone.
Any dip till 1400 can be used to buy for short term pullback towards 1600

GODREJPROPGodrejprop broke out of triangle pattern on 30 min TF with decent volumes.
Could be bought with mentioned stoploss & target.

Godrej Prop - support and resistance zones. LongStck is trading close to its recent support Zone. Decent risk reward on longs here for a move towards 1550-1600

Godrej Properties Supply Zone For ShortGodrej Properties SZ For Short
Entry = 1312
SL = 1319
Target 1 = 1255
Target 2 = 1180

