Godrejprop 1400+After trendline breakout retest, we can see cup and handle breakout on daily.
1400++ target
GODREJPROP trade ideas

GODREJPROPGodrejprop made rouning bottom pattern or saucer pattern on hourly chart with good volumes.
Also broke out of november highs.
Could be bought with mentioned stoploss & targets.

Bullish hammer in weeklyTook support at 1370-1390 level .
Formation of bullish candle in weekly chart

GodrejPropGodrejProp CMP 1258
We can see that my trend has turned bullish
also candles also turned bullish
As long as we hold 1190 levels (red line)
I am expecting it to touch 1675 levels (green line)
Vedang :)
Chart is for study purpose only!!!


Godrej properties Its creating a double bottom formation and this would be a nice time to go long on this stock as the stop loss would be very minimal.

GODREJ PROPERTIES GODREJ PROPERTIES - The CRAB pattern
A breakdown below point B has initiated targets for point D, however since consolidation is going on, we will wait for a breakdown below 1130, to initiate fresh shorts.

GODREJPROP for LongsBuy CMP 1200
Target 1470/1700/1938/2480+
Stop-loss 1130
#GODREJPROP #nifty #banknifty
Note: I'm not a SEBI registered research analyst or not a Financial Advisor, this is for educational purposes only, Before trading please consult your financial adviser.

Godrej Properties Long CallGodrej Properties is trading in its support levels and changing the trend to positive..
its a good trade since it started moving higher..

Godrej PropertiesGodrej Properties Limited is a real estate company engaged in construction and real estate development.
GODREJ PROPERTIES is Bearish Symmetrical chart pattern breakout wait for entry about of confirmation candle.
This channel is for only educational purpose. Any Profit/loss, I am not responsible.
Sector: Real Estate
Industry: Real Estate

GodrejProperties - ShortWill sell Godrej Properties as it has made M pattern and there is weekness in the chart. Rising interest rates in India and upcoming recession in US will reduce the disposable income, higher loan rates and people will delay buying properties. All these factors will add dampener to the property market and therefore selling on each rise strategy will make much more sense.

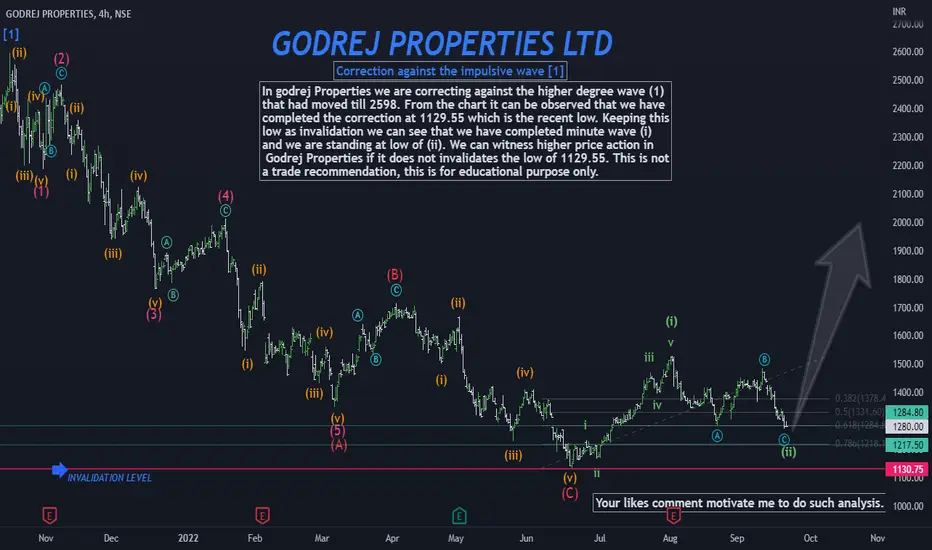
Godrej Properties Counts (Revisited)In godrej Properties we are correcting against the higher degree wave (1) that had moved till 2598. From the chart it can be observed that we have completed the correction at 1129.55 which is the recent low. Keeping this low as invalidation we can see that we have completed minute wave (i) and we are standing at low of (ii). We can witness higher price action in Godrej Properties if it does not invalidates the low of 1129.55. This is not a trade recommendation, this is for educational purpose only.
Thank you.
Godrej prop Strong recommended to buy godrej prop at 1460
Our target will be 1520
In upcoming days it will be fire 🔥🔥🔥❤️

Godrejproperty Elliott Wave Analysis TamilGodrejproperties Next target 0.382 Levels..
Time Duration 16 Trading Days target will Reach..

Godrej Properties Intraday tradeThere is a symmetrical triangle formation on 30 Mins chart of godrej properties. Triangle can breakout above or below the respective trend lines. Wait for the candle to breakout and close above or below trend lines.
This will be very short term trade and should be completed in one or two trading sessions.
Breakout level above = 1400
Breakout level below = 1384
Target = + 20 or -20 above or below breakout level
stop loss = 2% below breakout levels

Godrej propertiesOn hourly time frame the stock is trading near swing high resistance and breaking above 1418 will give a positive breakout.
You can trade this setup for swing trading

August Swing Trade Idea 3Engulfing candle on monthly TF formed at a bottom of structure. This trade is less probable and more risky as compared to the previous 2 trades I have posted for this month because the stock is already quite stretched, but has a much better risk-reward ratio.

GODREJ PROP Buy for intraday tradingGODREJ PROP Buy for intraday trading if stock break the previous days high then we will buy the stock.........

GODEJ PROPERTIES GODREJ PROPERTIES - Large pennant breakout at a strong demand zone.
The risk reward ratio is highly favourable here.
One can go long with a stop loss of 200 ema.

Godrej Properties for SWING tradingGodrej Properties showing falling wedge pattern and also positive divergence with RSI.
Buy around 1320 with a Stop of 1225 and target of around 1925.

GODREJ PROP for SWING tradingGODREJ PROP is seen to be forming a falling wedge pattern making lower highs and lower Iows. Also positive divergence is seen with RSI.
BUY above 1357 levels with an stop loss of 1225 and target near 1680.

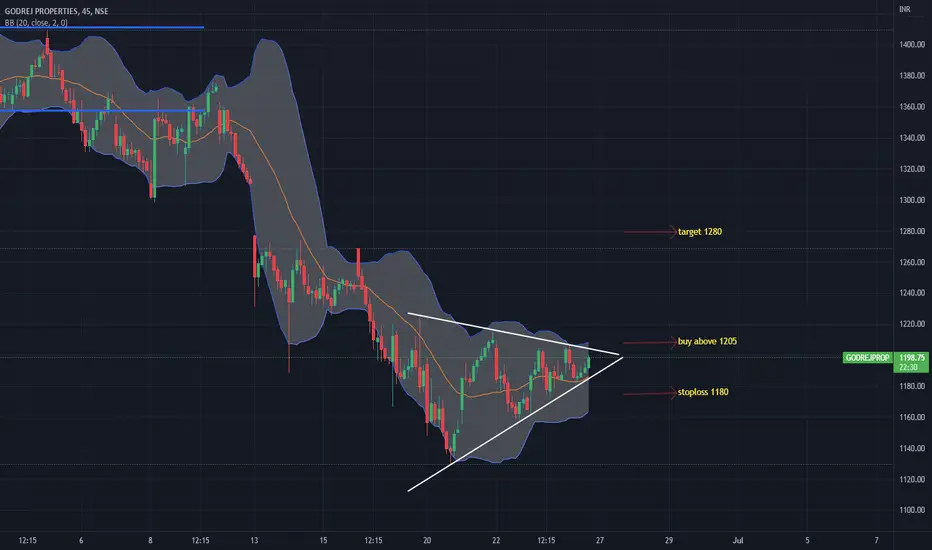
GODREJPROPGodrejprop made triangle pattern on an hourly chart with okayish volumes not broke out of it though.
So buy godrejprop above 1205 (breakout level)
With mentioned stoploss & target.
Godrej PropertiesTrendline break and Bullish Engulfing in Godrej Properties? This could be a long opportunity. Keep watch.
