Key stats
About NIP IND ETF GOLD BEES
Home page
Inception date
Mar 8, 2007
Structure
Open-Ended Fund
Replication method
Synthetic
Dividend treatment
Capitalizes
Primary advisor
Nippon Life India Asset Management Ltd. (Invt Mgmt)
ISIN
INF204KB17I5
The Scheme employs an investment approach designed to track the performance of physical gold
Related funds
Classification
What's in the fund
Exposure type
Miscellaneous
Bonds, Cash & Other100.00%
Miscellaneous98.72%
Cash1.28%
Top 10 holdings

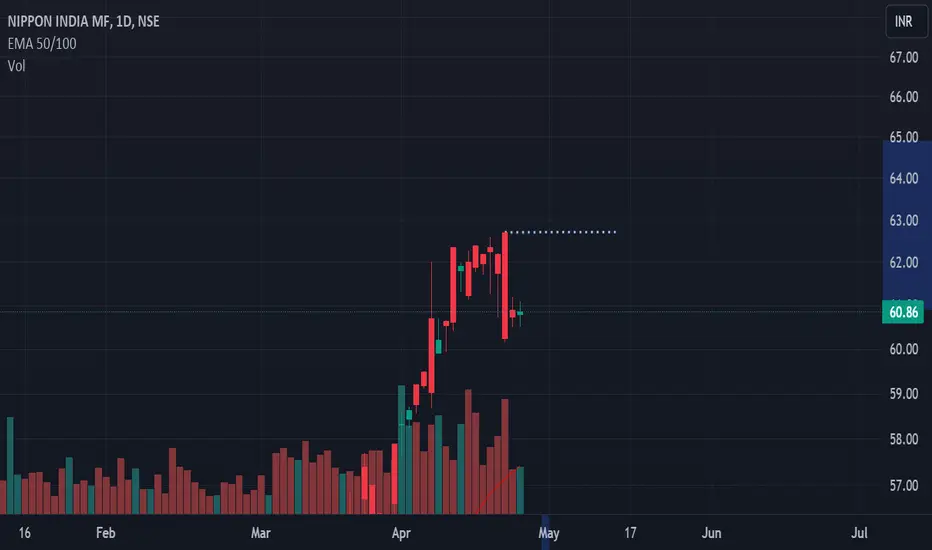
Time to catch Gold beesGold bees corrected and its at buying level
buy around 60, 61
small SL 60 or 59.50
Target 63, 65
Very low risk trade
Go for it guys
Educational purpose only
GOLDBEES : Booked a profit of 4.15%Took the entry on Oct 3rd 2023, which is just 2 weeks back. So a move of 4.15% in such a low volatile asset like Gold from a swing perspective is more than enough for me in the current market condition.
My primary intension was to park the money safely in the current uncertain situation and that in

Goldbees : Started to accumulateAdded Goldbees for about 5% of the total capital. There is a potential for about 9% move from the current levels to the all time highs. But during the same time the price of Gold will be moving up by around 14%.
The Gold ETFs listed in Indian market are trading at a premium valuation, unlike the o

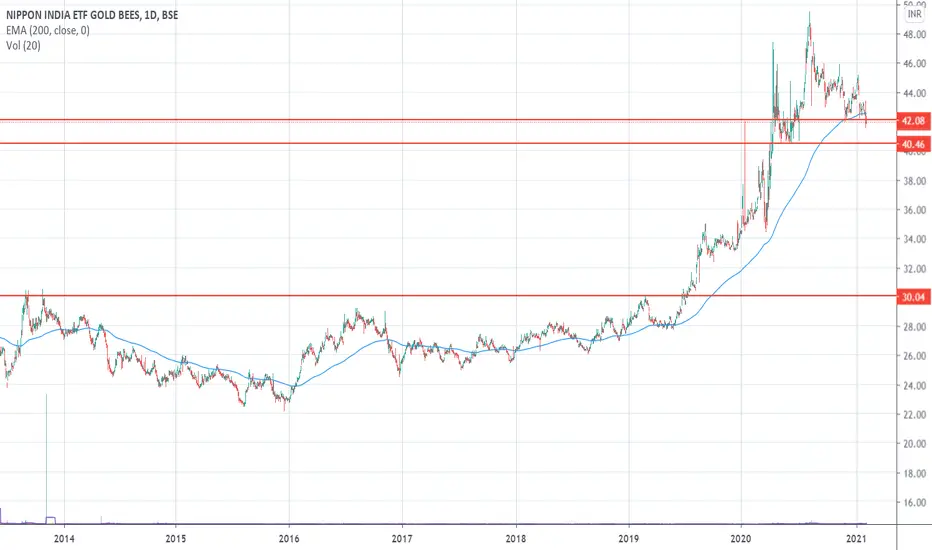
Nippon Gold ETF breaks out important resistanceGold ETF has given breakout at important resistance level of 52.16
One can consider for long position on Nippon Gold ETF since it's at an ATH


GOLD bees seems bullishGOLD bees seems bullish
RSI - Positive divergance
Making Falling wedge pattern may breakout
trading below 200 EMA

GoldBeeS - Accumulation Zone ComingGoldBees - After almost 2 years, it is now trading below 200 MA. Except for a period of 2 year bet 2014-16, it has only few days or weeks below 200 MA. So a good accumulation time till it trades below 200 MA.
DISC:Not a SEBI Registered. I post charts for my own study.
GoldBees - What is Gold ETF uptoGoldBees - Raising its head above the Trendline. Look at the CupnHandle in the making. What is it upto? Is it giving the signal ahead of the market.
DISCL: Not a SEBI Registered. I post charts for my own study.

GoldBEES - Freak Trades - Any Idea what these could be?Gold Bees - Any Idea what these freak trades are all about...?

See all ideas
Summarizing what the indicators are suggesting.
Oscillators
Neutral
SellBuy
Strong sellStrong buy
Strong sellSellNeutralBuyStrong buy
Oscillators
Neutral
SellBuy
Strong sellStrong buy
Strong sellSellNeutralBuyStrong buy
Summary
Neutral
SellBuy
Strong sellStrong buy
Strong sellSellNeutralBuyStrong buy
Summary
Neutral
SellBuy
Strong sellStrong buy
Strong sellSellNeutralBuyStrong buy
Summary
Neutral
SellBuy
Strong sellStrong buy
Strong sellSellNeutralBuyStrong buy
Moving Averages
Neutral
SellBuy
Strong sellStrong buy
Strong sellSellNeutralBuyStrong buy
Moving Averages
Neutral
SellBuy
Strong sellStrong buy
Strong sellSellNeutralBuyStrong buy
Displays a symbol's price movements over previous years to identify recurring trends.
Frequently Asked Questions
An exchange-traded fund (ETF) is a collection of assets (stocks, bonds, commodities, etc.) that track an underlying index and can be bought on an exchange like individual stocks.
GOLDBEES trades at 81.95 INR today, its price has fallen −0.30% in the past 24 hours. Track more dynamics on GOLDBEES price chart.
GOLDBEES price has risen by 0.96% over the last month, and its yearly performance shows a 39.32% increase. See more dynamics on GOLDBEES price chart.
NAV returns, another gauge of an ETF dynamics, have risen by −0.44% over the last month, have fallen by −0.44% over the last month, showed a 3.84% increase in three-month performance and has increased by 8.07% in a year.
NAV returns, another gauge of an ETF dynamics, have risen by −0.44% over the last month, have fallen by −0.44% over the last month, showed a 3.84% increase in three-month performance and has increased by 8.07% in a year.
GOLDBEES fund flows account for 6.97 B INR (1 year). Many traders use this metric to get insight into investors' sentiment and evaluate whether it's time to buy or sell the fund.
Since ETFs work like an individual stock, they can be bought and sold on exchanges (e.g. NASDAQ, NYSE, EURONEXT). As it happens with stocks, you need to select a brokerage to access trading. Explore our list of available brokers to find the one to help execute your strategies. Don't forget to do your research before getting to trading. Explore ETFs metrics in our ETF screener to find a reliable opportunity.
GOLDBEES invests in cash. See more details in our Analysis section.
GOLDBEES expense ratio is 0.79%. It's an important metric for helping traders understand the fund's operating costs relative to assets and how expensive it would be to hold the fund.
No, GOLDBEES isn't leveraged, meaning it doesn't use borrowings or financial derivatives to magnify the performance of the underlying assets or index it follows.
In some ways, ETFs are safe investments, but in a broader sense, they're not safer than any other asset, so it's crucial to analyze a fund before investing. But if your research gives a vague answer, you can always refer to technical analysis.
Today, GOLDBEES technical analysis shows the buy rating and its 1-week rating is buy. Since market conditions are prone to changes, it's worth looking a bit further into the future — according to the 1-month rating GOLDBEES shows the buy signal. See more of GOLDBEES technicals for a more comprehensive analysis.
Today, GOLDBEES technical analysis shows the buy rating and its 1-week rating is buy. Since market conditions are prone to changes, it's worth looking a bit further into the future — according to the 1-month rating GOLDBEES shows the buy signal. See more of GOLDBEES technicals for a more comprehensive analysis.
No, GOLDBEES doesn't pay dividends to its holders.
GOLDBEES trades at a premium (0.13%).
Premium/discount to NAV expresses the difference between the ETF’s price and its NAV value. A positive percentage indicates a premium, meaning the ETF trades at a higher price than the calculated NAV. Conversely, a negative percentage indicates a discount, suggesting the ETF trades at a lower price than NAV.
Premium/discount to NAV expresses the difference between the ETF’s price and its NAV value. A positive percentage indicates a premium, meaning the ETF trades at a higher price than the calculated NAV. Conversely, a negative percentage indicates a discount, suggesting the ETF trades at a lower price than NAV.
GOLDBEES shares are issued by Nippon Life Insurance Co.
GOLDBEES follows the MCX Gold (INR/10g). ETFs usually track some benchmark seeking to replicate its performance and guide asset selection and objectives.
The fund started trading on Mar 8, 2007.
The fund's management style is passive, meaning it's aiming to replicate the performance of the underlying index by holding assets in the same proportions as the index. The goal is to match the index's returns.