Next report date
—
Report period
—
EPS estimate
—
Revenue estimate
—
10.95 INR
1.17 B INR
7.81 B INR
37.27 M
About GOLDIAM INTERNATIONAL LTD
Sector
Industry
CEO
Anmol Rashesh Bhansali
Website
Headquarters
Mumbai
Founded
1986
ISIN
INE025B01025
FIGI
BBG000C08GD7
Goldiam International Ltd. is a holding company, which engages in the manufacture and export of diamond studded gold and silver jewelry products. It operates through the Jewellery Manufacturing Activity and Investment Activity segments. The company was founded on October 10, 1986 and is headquartered in Mumbai, India.
Related stocks

Goldiam International - Positional Trade Idea🚀 Breakout Alert!
Goldiam International breaks out above strong resistance at ₹400 with volume confirmation.
Entry: ₹437+
Target 1: ₹480
Target 2: ₹500
Stop-loss: ₹395
RSI remains strong at 50, signaling room for upward momentum. Watch for sustained volume as the stock continues its breakout.
#Gol

50 SMA Rising- Positional TradeDisclaimer: I am not a Sebi registered adviser.
This Idea is publish purely for educational purpose only before investing in any stocks please take advise from your financial adviser.
Its 50 SMA Rising Strategy. Suitable for Positional Trading Initial Stop loss lowest of last 2 candles and keep tra

SWING IDEA - GOLDIAMNSE:GOLDIAM bags INR 600m worth of order for Gold Jewelry.
In addition, even the MACD is about to make a crossover on the weekly charts. This can indicate a good move upward as it comes at the same time that even the company has bagged a very huge order.
If everything goes well, the stock could ea

GOLDIAMWhat a Golden Opportunity
After Breaking ATH of 2006 , it has risen pretty well one sided creating a pole , then consolidated sideways to form a Flag and then finally a strong monthly Breakout

Goldiam International LtdInverted H&S formation and good base formation. Looking Good once closed above 195 and sustains. We Can look 250+ targets.

Trade Idea in GOLDIAM
Swing Trade in NSE:GOLDIAM
CMP 191
TP 227
SL 165
Goldiam International Ltd. is a holding company, which engages in the manufacture and export of diamond studded gold and silver jewelry products. It operates through the Jewellery Manufacturing Activity and Investment Activity segments. The com

GOLDIAM - Could be a gold mine in the Mid Term :-)An Investment pick, for target of 372,50% + ROI, after the all time high of 272 is taken off.
The stock is strong in all higher time frames. Showing Fibonacci 61% retracement in Monthly, moving strong to take off the Swing High at 272.
Volumes and Price action confirmation in weekly.
One may ac

Goldiam international ltd Expecting a volume spurt till end of the day and a good momentum for a intraday trade
Swing trade on a closing above 206
Sl 183
Tgt 224 250 280
Rr of 1:1
Ask your financial advisor before buying only for educational purposes

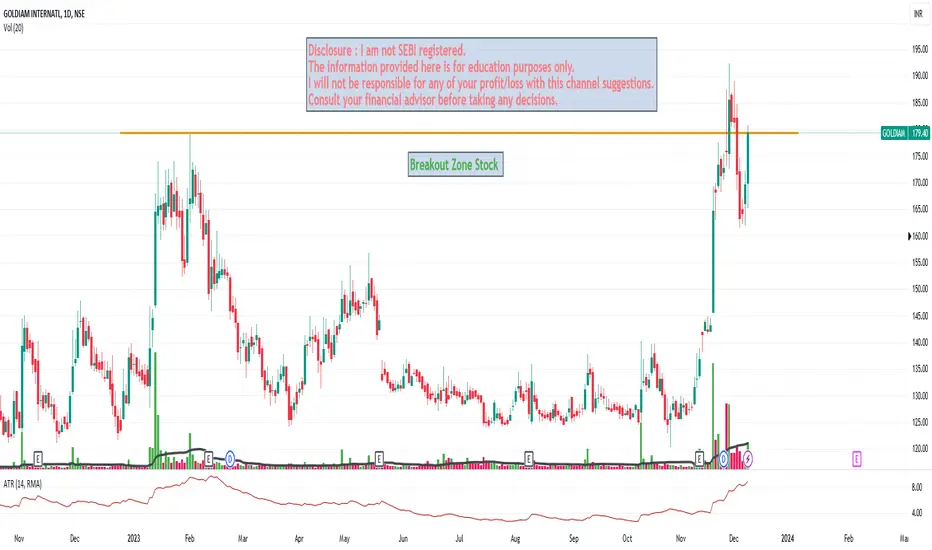
Goldiam International Ltd. Breakout Zone Buy Above 185 With SLGoldiam International Ltd.
Buy Above Not Before 185
Stop Loss : 160
Target : 210-235
Holding Time : 1-2 Month
Disclosure : I am not SEBI registered.The information provided here is for education purposes only.I will not be responsible for any of your profit/loss with this channel suggest
See all ideas
Summarizing what the indicators are suggesting.
Oscillators
Neutral
SellBuy
Strong sellStrong buy
Strong sellSellNeutralBuyStrong buy
Oscillators
Neutral
SellBuy
Strong sellStrong buy
Strong sellSellNeutralBuyStrong buy
Summary
Neutral
SellBuy
Strong sellStrong buy
Strong sellSellNeutralBuyStrong buy
Summary
Neutral
SellBuy
Strong sellStrong buy
Strong sellSellNeutralBuyStrong buy
Summary
Neutral
SellBuy
Strong sellStrong buy
Strong sellSellNeutralBuyStrong buy
Moving Averages
Neutral
SellBuy
Strong sellStrong buy
Strong sellSellNeutralBuyStrong buy
Moving Averages
Neutral
SellBuy
Strong sellStrong buy
Strong sellSellNeutralBuyStrong buy
Displays a symbol's price movements over previous years to identify recurring trends.
Frequently Asked Questions
The current price of GOLDIAM is 336.60 INR — it has decreased by −0.50% in the past 24 hours. Watch GOLDIAM INTERNATIONAL LTD stock price performance more closely on the chart.
Depending on the exchange, the stock ticker may vary. For instance, on NSE exchange GOLDIAM INTERNATIONAL LTD stocks are traded under the ticker GOLDIAM.
GOLDIAM stock has fallen by −8.54% compared to the previous week, the month change is a −2.44% fall, over the last year GOLDIAM INTERNATIONAL LTD has showed a 78.30% increase.
GOLDIAM reached its all-time high on Jan 16, 2025 with the price of 569.00 INR, and its all-time low was 2.10 INR and was reached on Mar 9, 2009. View more price dynamics on GOLDIAM chart.
See other stocks reaching their highest and lowest prices.
See other stocks reaching their highest and lowest prices.
GOLDIAM stock is 2.10% volatile and has beta coefficient of 2.54. Track GOLDIAM INTERNATIONAL LTD stock price on the chart and check out the list of the most volatile stocks — is GOLDIAM INTERNATIONAL LTD there?
Today GOLDIAM INTERNATIONAL LTD has the market capitalization of 35.85 B, it has decreased by −0.04% over the last week.
Yes, you can track GOLDIAM INTERNATIONAL LTD financials in yearly and quarterly reports right on TradingView.
GOLDIAM INTERNATIONAL LTD is going to release the next earnings report on Aug 12, 2025. Keep track of upcoming events with our Earnings Calendar.
GOLDIAM net income for the last quarter is 232.37 M INR, while the quarter before that showed 497.91 M INR of net income which accounts for −53.33% change. Track more GOLDIAM INTERNATIONAL LTD financial stats to get the full picture.
EBITDA measures a company's operating performance, its growth signifies an improvement in the efficiency of a company. GOLDIAM INTERNATIONAL LTD EBITDA is 1.60 B INR, and current EBITDA margin is 20.43%. See more stats in GOLDIAM INTERNATIONAL LTD financial statements.
Like other stocks, GOLDIAM shares are traded on stock exchanges, e.g. Nasdaq, Nyse, Euronext, and the easiest way to buy them is through an online stock broker. To do this, you need to open an account and follow a broker's procedures, then start trading. You can trade GOLDIAM INTERNATIONAL LTD stock right from TradingView charts — choose your broker and connect to your account.
Investing in stocks requires a comprehensive research: you should carefully study all the available data, e.g. company's financials, related news, and its technical analysis. So GOLDIAM INTERNATIONAL LTD technincal analysis shows the sell today, and its 1 week rating is sell. Since market conditions are prone to changes, it's worth looking a bit further into the future — according to the 1 month rating GOLDIAM INTERNATIONAL LTD stock shows the buy signal. See more of GOLDIAM INTERNATIONAL LTD technicals for a more comprehensive analysis.
If you're still not sure, try looking for inspiration in our curated watchlists.
If you're still not sure, try looking for inspiration in our curated watchlists.