GOLDIAM trade ideas

Goldiam International - Positional Trade Idea🚀 Breakout Alert!
Goldiam International breaks out above strong resistance at ₹400 with volume confirmation.
Entry: ₹437+
Target 1: ₹480
Target 2: ₹500
Stop-loss: ₹395
RSI remains strong at 50, signaling room for upward momentum. Watch for sustained volume as the stock continues its breakout.
#Goldiam #BreakoutTrade #PositionalTrade #StockMarket

50 SMA Rising- Positional TradeDisclaimer: I am not a Sebi registered adviser.
This Idea is publish purely for educational purpose only before investing in any stocks please take advise from your financial adviser.
Its 50 SMA Rising Strategy. Suitable for Positional Trading Initial Stop loss lowest of last 2 candles and keep trailing with 50 days SMA if price close below 50 SMA then Exit or be in the trade some time trade can go for several months.
Be Discipline because discipline is the Key to Success in the STOCK Market.
Trade What you see not what you Think

SWING IDEA - GOLDIAMNSE:GOLDIAM bags INR 600m worth of order for Gold Jewelry.
In addition, even the MACD is about to make a crossover on the weekly charts. This can indicate a good move upward as it comes at the same time that even the company has bagged a very huge order.
If everything goes well, the stock could easily hit the next Support/Resistance zone very comfortably and further up too.

GOLDIAMWhat a Golden Opportunity
After Breaking ATH of 2006 , it has risen pretty well one sided creating a pole , then consolidated sideways to form a Flag and then finally a strong monthly Breakout

Goldiam International LtdInverted H&S formation and good base formation. Looking Good once closed above 195 and sustains. We Can look 250+ targets.

Trade Idea in GOLDIAM
Swing Trade in NSE:GOLDIAM
CMP 191
TP 227
SL 165
Goldiam International Ltd. is a holding company, which engages in the manufacture and export of diamond studded gold and silver jewelry products. It operates through the Jewellery Manufacturing Activity and Investment Activity segments. The company was founded on October 10, 1986 and is headquartered in Mumbai, India.

GOLDIAM - Could be a gold mine in the Mid Term :-)An Investment pick, for target of 372,50% + ROI, after the all time high of 272 is taken off.
The stock is strong in all higher time frames. Showing Fibonacci 61% retracement in Monthly, moving strong to take off the Swing High at 272.
Volumes and Price action confirmation in weekly.
One may accumulate in dips till 164 levels. Stock structure becomes weak only on weekly closing less than 164.
One may consider entry based on risk management.

Goldiam international ltd Expecting a volume spurt till end of the day and a good momentum for a intraday trade
Swing trade on a closing above 206
Sl 183
Tgt 224 250 280
Rr of 1:1
Ask your financial advisor before buying only for educational purposes

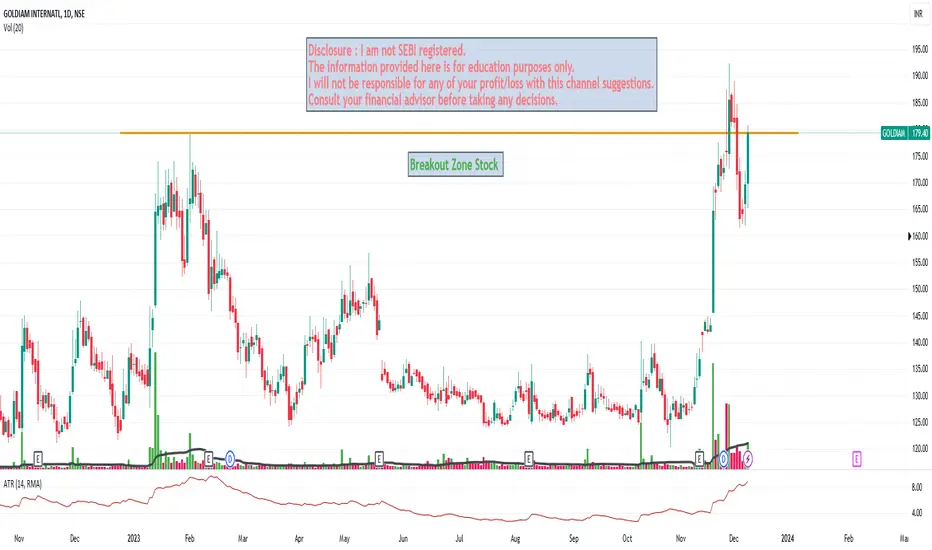
Goldiam International Ltd. Breakout Zone Buy Above 185 With SLGoldiam International Ltd.
Buy Above Not Before 185
Stop Loss : 160
Target : 210-235
Holding Time : 1-2 Month
Disclosure : I am not SEBI registered.The information provided here is for education purposes only.I will not be responsible for any of your profit/loss with this channel suggestions.Consult your financial advisor before taking any decisions.
Goldiam - Bullish Flag PatternA must buy portfolio stock for long term investment.
Goldiam CMP - 183
Buy At Current Price 183
Target 1 - 200
Target 2 - 250
Target 3 - 300
Disclaimer: This is my view and for educational purpose only. Trade according to your risk and am not responsible for your loss.

Goldiam International Goldiam International
giving desending triangle breakout with
volumn in weekly chart
CMP - 168
Short term tgt 180/210++
Stop Loss around 120


GOLDIAM INTERNATIONAL looks good NSE:GOLDIAM Levels for SWING
Wizard Levels/Zones
>Hey buddy, Wait for the price to close above or below-mentioned zones. Once the price closes above or below, SUPPORT becomes RESISTANCE and RESISTANCE becomes SUPPORT.
> If you're following these zones then kindly follow the rules too. Risk management, and Position sizing.
> This is my perception of the market so, kindly do your analysis to get more clarity on the market.
> These levels might help you guys. As per my view, I'm sharing it with you guys.
> This is not a blueprint to happen, so kindly do your own analysis and my view. Thank you for your SUPPORT


📈 Exciting Bullish Pattern Alert! 🐂📊 Pattern: Symmetric Triangle
📌 Symbol/Asset: Goldiam International
🔍 Description: Stock at pattern's strong support
👉 Remember: Technical patterns are just one piece of the puzzle. Consider conducting further research, consulting with a financial advisor, and managing your risks appropriately.

Triangle pattern breakout. 17% targetHigh chances of triangle pattern breakout
in Day pattern
17% target for the next Resistance level
Support was already taken 4 times.
Risk reward ratio: 6

GOLDIAM Now Demand ZoneAs Given JUNE/JULY* 2022 - _GOLDIAM Perfectly Running in the Channel--- Base on Demand with small Risk now Again buying Zone Running... -
So can go long...

Goldiam Demand n Supply zoneGOLDIAM - D&S Zones
1. Resistance 160-64 above go for 190-198 if Hold 160 164 than Ready for Downside again 136 110 ++
2. Major resistance 196-210 - Best time to exit form long - as we can see dowm side 90 68 36 level.
NOTE - Fresh long holding only depend in BO above 210

Goldiam International Investment ideaFundamentals:-
Company has reduced debt.
Company is almost debt free.
Company is expected to give good quarter
Company has delivered good profit growth of 37.6% CAGR over last 5 years
Company has been maintaining a healthy dividend payout of 24.1%
Technicals:-
Seems bouncing from demand zone.
Closed above resistance trendline.
Good for investment around 120-140.
SL closing below 105.
24% dividend is cherry on top.
Education purpose only. not a sebi registered advisor.
Saptarish Trading

GOLDIAMIt can be bought above 165 and SL can be kept at 157. Some positive announcement was there in budget related to stock and huge buying interest has emerged here. It can give good returns once the channel is broken on upside

Goldiam International LtdGoldiam International Ltd
C&H Pattern in Making: Yrly Basis
C&H / 5 Yr Price Trendline BreakOut: 18% Upside Needed / Sustained.
Weakness in Vol. / BuiltUp & BreakOut Needed
*With Upside, Trail SL*
*Book Profit as per Risk Appetite*
*Snapshot*
Estab. in ’86, Engaged in Mfg. / Exporting Gold / Diamond jewelry to global retailers.
95% Sales: USA. Rest: UK, Russia, Dubai, China, HK, Australia. Sales Breakup - 80%/20%: Retailers/Wholesalers.
Fully backward integrated.
Holds patent for the laboratory-manufacturing process of diamonds. Getting into E-Com. Sales
Declining Sales: Qtrly Basis. Sales / Profitability: Growing on Yrl Basis.
Growing TNW / Nil Debt
CF from Ops +ve till FY21. -ve In FY22.
Sharply Improving RoA/ RoE/RoCE. Moving into higher Double Digits.
H1-FY23: Order Book at Rs.150 Crs. C&CE at Rs.174 Crs.
*Concern:*
Dependence on US Market.
*Do Your Own Research as Well. This is Just an Opinion.*
Happy Investing :)

