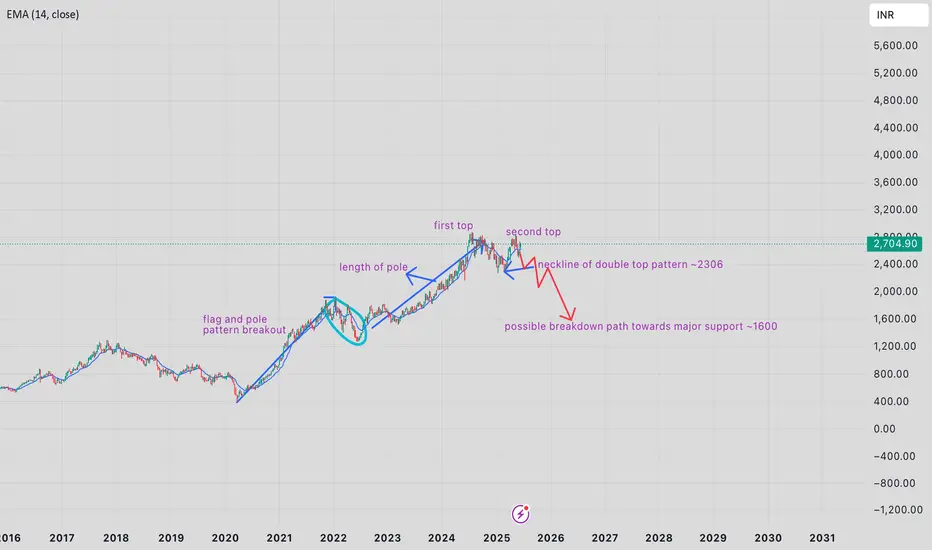
Possible breakdown of GRASIM-EQ GRASIM-EQ has reached its 100% fib lvls and there is a high chance that price will not be able to cross its recent ATH of ~2875 lvls.
which leads us to the current formation of double top pattern on weekly basis as shown in the pic. the neckline of double top pattern stands near ~2300 lvl which whe
Next report date
—
Report period
—
EPS estimate
—
Revenue estimate
—
59.15 INR
37.06 B INR
1.48 T INR
356.91 M
About GRASIM INDUSTRIES LTD
Sector
Industry
CEO
Himanshu Kapania
Website
Headquarters
Mumbai
Founded
1947
ISIN
INE047A01021
FIGI
BBG000BK6ZP1
Grasim Industries Ltd. engages in the production of chemicals and cement. It operates through the following segments: Viscose, Chemicals, Cement, Financial Services, and Others. The Viscose Staple Fibre segment offers wood pulp and yarn. The Chemicals segment produces caustic soda, allied chemicals, and epoxy. The Cement segment provides grey cement, white cement, and allied products. The Financial Services segment is responsible for the non-bank financial services, life insurance services, housing finance, private equity, equity and commodity broking, wealth management, general insurance advisory, and health insurance. The Others segment relates to textiles, insulators, agri-business and solar power. The company was on August 25, 1947 and is headquartered in Mumbai, India.
Related stocks
Grasmi InDustries - Long Set-UPNSE:GRASIM
𝐆𝐫𝐚𝐬𝐢𝐦 𝐈𝐧𝐝𝐮𝐬𝐭𝐫𝐢𝐞𝐬
𝐄𝐧𝐭𝐫𝐘 Between 2530 -- 2600 (Weekly FVG)
𝐒𝐋 Below 2460 ( Swing Low
𝐓𝐚𝐫𝐠𝐞𝐭 - 2750 , 2800++

GRASIMNSE:GRASIM
Note :
1. One should go long with a Stop Loss, below the Trendline or the Previous Swing Low.
2. Risk :Reward ratio should be minimum 1:2.
3. Plan your trade as per the Money Management and Risk Appetite.
Disclaimer :
>You are responsible for your profits and loss.
>The idea shared

#GRASIM INDUSTRIES (Supply Zone)Identify critical supply zones for GRASIM INDUSTRIES using advanced technical analysis. These zones highlight potential resistance areas where price reversals or pullbacks may occur, offering strategic opportunities for traders. Ideal for swing traders, breakout traders, and those focusing on risk m

#GRASIM INDUSTRIES SUPPLY ZONEGrasim Industries, commonly known as Grasim, is a flagship company of the Aditya Birla Group. It is a leading player in the viscose staple fiber (VSF) and cement sectors, among other businesses. Grasim Industries operates in various supply zones depending on the product and market demand.

H&S breakdown in GRASIMNSE:GRASIM hourly chart shows head and shoulder breakdown in hourly chart. Most H&S breakdowns are followed by retest so chances are there would be an attempt to reclaim the neckline resistance.

Review and plan for 11th February 2025 Nifty future and banknifty future analysis and intraday plan.
Result analysis.
This video is for information/education purpose only. you are 100% responsible for any actions you take by reading/viewing this post.
please consult your financial advisor before taking any action.
----Vinaykumar hi

Grasim - Quick 10% move Grasim expected to get rejected from the levels of 2370.
This short term move has produce 9 to 10%.


grasimgrasim
Breakout of rounding bottom pattern
support near 2580 for intraday
RSI>60
Short term target is 2800++
crossover of 10/20/50 days

See all ideas
Summarizing what the indicators are suggesting.
Neutral
SellBuy
Strong sellStrong buy
Strong sellSellNeutralBuyStrong buy
Neutral
SellBuy
Strong sellStrong buy
Strong sellSellNeutralBuyStrong buy
Neutral
SellBuy
Strong sellStrong buy
Strong sellSellNeutralBuyStrong buy
An aggregate view of professional's ratings.
Neutral
SellBuy
Strong sellStrong buy
Strong sellSellNeutralBuyStrong buy
Neutral
SellBuy
Strong sellStrong buy
Strong sellSellNeutralBuyStrong buy
Neutral
SellBuy
Strong sellStrong buy
Strong sellSellNeutralBuyStrong buy
Displays a symbol's price movements over previous years to identify recurring trends.
750GIL27
GIL-7.50%-10-6-27-PVTYield to maturity
—
Maturity date
Jun 10, 2027
699GIL31
GIL-6.99%-4-4-31-PVTYield to maturity
—
Maturity date
Apr 4, 2031
721GIL34
GIL-7.21%-19-12-34-PVTYield to maturity
—
Maturity date
Dec 19, 2034
763GIL27
GIL-7.63%-01-2-27-PVTYield to maturity
—
Maturity date
Dec 1, 2027
656GIL30
GIL-6.56%-06-06-30-PVTYield to maturity
—
Maturity date
Jun 6, 2030
See all GRASIM bonds
Frequently Asked Questions
The current price of GRASIM is 2,708.60 INR — it has decreased by −1.00% in the past 24 hours. Watch GRASIM INDUSTRIES LTD stock price performance more closely on the chart.
Depending on the exchange, the stock ticker may vary. For instance, on NSE exchange GRASIM INDUSTRIES LTD stocks are traded under the ticker GRASIM.
GRASIM stock has fallen by −2.25% compared to the previous week, the month change is a −2.98% fall, over the last year GRASIM INDUSTRIES LTD has showed a −3.44% decrease.
We've gathered analysts' opinions on GRASIM INDUSTRIES LTD future price: according to them, GRASIM price has a max estimate of 3,500.00 INR and a min estimate of 2,698.00 INR. Watch GRASIM chart and read a more detailed GRASIM INDUSTRIES LTD stock forecast: see what analysts think of GRASIM INDUSTRIES LTD and suggest that you do with its stocks.
GRASIM reached its all-time high on Jun 27, 2025 with the price of 2,896.00 INR, and its all-time low was 16.65 INR and was reached on Apr 28, 1999. View more price dynamics on GRASIM chart.
See other stocks reaching their highest and lowest prices.
See other stocks reaching their highest and lowest prices.
GRASIM stock is 1.55% volatile and has beta coefficient of 1.15. Track GRASIM INDUSTRIES LTD stock price on the chart and check out the list of the most volatile stocks — is GRASIM INDUSTRIES LTD there?
Today GRASIM INDUSTRIES LTD has the market capitalization of 1.84 T, it has decreased by −0.53% over the last week.
Yes, you can track GRASIM INDUSTRIES LTD financials in yearly and quarterly reports right on TradingView.
GRASIM INDUSTRIES LTD is going to release the next earnings report on Aug 8, 2025. Keep track of upcoming events with our Earnings Calendar.
GRASIM earnings for the last quarter are −3.40 INR per share, whereas the estimation was −2.10 INR resulting in a −61.90% surprise. The estimated earnings for the next quarter are −4.70 INR per share. See more details about GRASIM INDUSTRIES LTD earnings.
GRASIM INDUSTRIES LTD revenue for the last quarter amounts to 89.26 B INR, despite the estimated figure of 86.05 B INR. In the next quarter, revenue is expected to reach 91.52 B INR.
GRASIM net income for the last quarter is 14.96 B INR, while the quarter before that showed 8.99 B INR of net income which accounts for 66.40% change. Track more GRASIM INDUSTRIES LTD financial stats to get the full picture.
Yes, GRASIM dividends are paid annually. The last dividend per share was 10.00 INR. As of today, Dividend Yield (TTM)% is 0.37%. Tracking GRASIM INDUSTRIES LTD dividends might help you take more informed decisions.
GRASIM INDUSTRIES LTD dividend yield was 0.38% in 2024, and payout ratio reached 18.00%. The year before the numbers were 0.44% and 11.72% correspondingly. See high-dividend stocks and find more opportunities for your portfolio.
As of Jul 27, 2025, the company has 47.02 K employees. See our rating of the largest employees — is GRASIM INDUSTRIES LTD on this list?
EBITDA measures a company's operating performance, its growth signifies an improvement in the efficiency of a company. GRASIM INDUSTRIES LTD EBITDA is 373.87 B INR, and current EBITDA margin is 24.77%. See more stats in GRASIM INDUSTRIES LTD financial statements.
Like other stocks, GRASIM shares are traded on stock exchanges, e.g. Nasdaq, Nyse, Euronext, and the easiest way to buy them is through an online stock broker. To do this, you need to open an account and follow a broker's procedures, then start trading. You can trade GRASIM INDUSTRIES LTD stock right from TradingView charts — choose your broker and connect to your account.
Investing in stocks requires a comprehensive research: you should carefully study all the available data, e.g. company's financials, related news, and its technical analysis. So GRASIM INDUSTRIES LTD technincal analysis shows the sell today, and its 1 week rating is buy. Since market conditions are prone to changes, it's worth looking a bit further into the future — according to the 1 month rating GRASIM INDUSTRIES LTD stock shows the buy signal. See more of GRASIM INDUSTRIES LTD technicals for a more comprehensive analysis.
If you're still not sure, try looking for inspiration in our curated watchlists.
If you're still not sure, try looking for inspiration in our curated watchlists.