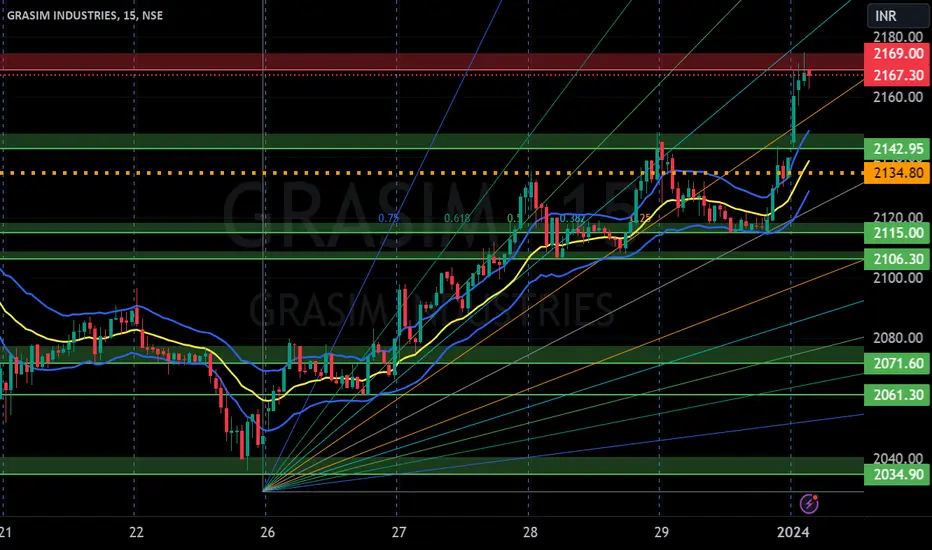
GRASIM INDUSTRIES S/R for 29/6/24Support and Resistance Levels: In technical analysis, support and resistance levels are significant price levels where buying or selling interest tends to be strong. They are identified based on previous price levels where the price has shown a tendency to reverse or find support.
Support levels are represented by the green line and green shade, indicating areas where buying interest may emerge to prevent further price decline.
Resistance levels are represented by the red line and red shade, indicating areas where selling pressure may arise to prevent further price increases. Traders often consider these levels as potential buying or selling opportunities.
Breakouts: Breakouts occur when the price convincingly moves above a resistance level (red shade) or below a support level (green shade). A bullish breakout above resistance suggests the potential for further price increases, while a bearish breakout below support suggests the potential for further price declines. Traders pay attention to these breakout signals as they may indicate the start of a new trend or significant price movement.
Disclosure: I am not SEBI registered. The information provided here is for learning purposes only and should not be interpreted as financial advice. It is important to consult with a qualified financial advisor before making any investment decisions. Tweets neither advice nor endorsement.
GRASIM trade ideas

Grasim Bullish Trade IDeaFor Grasim, I am still holding bullish conviction. Chart is showing good strength on the daily time frame. has been bouncing off this trendline.
Entering Long calls above PDH


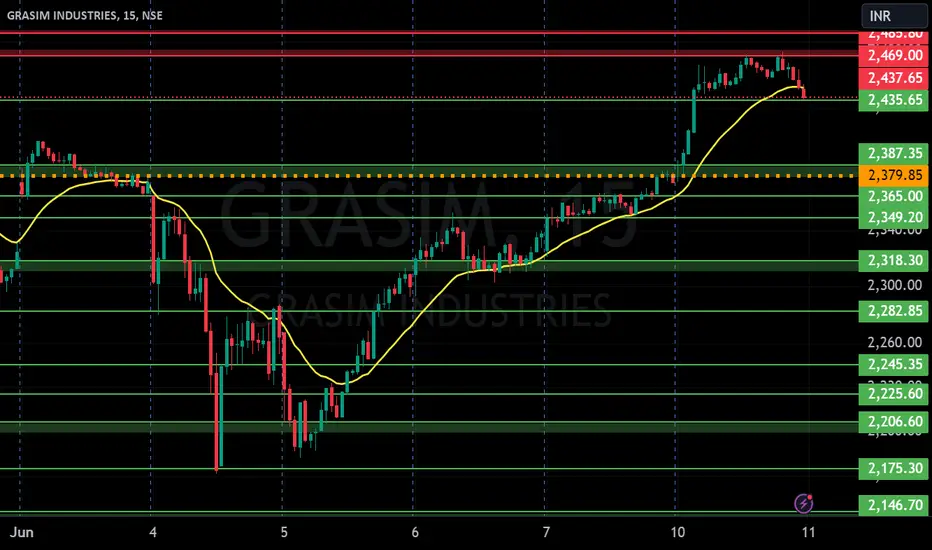
GRASIM INDUSTRIES S/RSupport and Resistance Levels: In technical analysis, support and resistance levels are significant price levels where buying or selling interest tends to be strong. They are identified based on previous price levels where the price has shown a tendency to reverse or find support.
Support levels are represented by the green line and green shade, indicating areas where buying interest may emerge to prevent further price decline.
Resistance levels are represented by the red line and red shade, indicating areas where selling pressure may arise to prevent further price increases. Traders often consider these levels as potential buying or selling opportunities.
Breakouts: Breakouts occur when the price convincingly moves above a resistance level (red shade) or below a support level (green shade). A bullish breakout above resistance suggests the potential for further price increases, while a bearish breakout below support suggests the potential for further price declines. Traders pay attention to these breakout signals as they may indicate the start of a new trend or significant price movement.
Disclosure: I am not SEBI registered. The information provided here is for learning purposes only and should not be interpreted as financial advice. It is important to consult with a qualified financial advisor before making any investment decisions. Tweets neither advice nor endorsement.
Grasim - Potential UpsideLTP on NSE on 23/Feb/2024 was INR 2,190/- (with a high of INR 2,236.70 and a low of INR 2,182.60)
Although it is a good buy at current levels, conservatively I would still accumulate it around INR 2,060/- - 2,080/- zone.
Resultantly after all this discussion, I believe that the target price should be:
first INR 2,370/- and
second INR 2,900/-.
Stop Loss should be INR 2,040/-
Risk to Reward will be 1:5
The time horizon should be 12-15 months

GRASIM S/RSupport and Resistance Levels: In technical analysis, support and resistance levels are significant price levels where buying or selling interest tends to be strong. They are identified based on previous price levels where the price has shown a tendency to reverse or find support.
Support levels are represented by the green line and green shade, indicating areas where buying interest may emerge to prevent further price decline.
Resistance levels are represented by the red line and red shade, indicating areas where selling pressure may arise to prevent further price increases. Traders often consider these levels as potential buying or selling opportunities.
Breakouts: Breakouts occur when the price convincingly moves above a resistance level (red shade) or below a support level (green shade). A bullish breakout above resistance suggests the potential for further price increases, while a bearish breakout below support suggests the potential for further price declines. Traders pay attention to these breakout signals as they may indicate the start of a new trend or significant price movement.
Disclosure: I am not SEBI registered. The information provided here is for learning purposes only and should not be interpreted as financial advice. It is important to consult with a qualified financial advisor before making any investment decisions. Tweets neither advice nor endorsement.

MARKET SAARTHI- STRONG BUY EXPLAINEDstrong buy @ max resistance area is level of highest resistance a script is likely to face from previous days of price action, though not computed those ways but in most cases, it represents the zone of call writers, historic resistance (in time frame u are trading) could bring reversal once we have price rejection from the area. it’s a area of high activity thus a user should be trading with caution and waiting out for strong buy signal for a highly trending move.
rules for trading max resistance area:
1) strong buy candle should be fully green
2) in case follow up candle is big and meets first 2 levels in a single move, our entry should be on hold and wait for price to retrace back to max resistance area.
3) upon retracement if we get consolidation with green candles, we can plan an entry above high of reference candle with ref candle low being sl.
4) targets will be levels above
5) in case of strong buy till price is trading above max resistance area, upon breaking of each level new entries can be initiated by keep low of breakout candle as sl.

Grasim Long PositionalBuy Grasim above 2147
Target of 2209-2487-3043
SL 1959
Strategy : SBO + RSI > 60 + EMA above 20 & 50
Duration few weeks
Please consult your financial advisor before investing
All research for educational purposes only.
Stock is ready to cross past barriers with good volumes

GRASIM INDUSTRIES S/RSupport and Resistance Levels: In technical analysis, support and resistance levels are significant price levels where buying or selling interest tends to be strong. They are identified based on previous price levels where the price has shown a tendency to reverse or find support.
Support levels are represented by the green line and green shade, indicating areas where buying interest may emerge to prevent further price decline.
Resistance levels are represented by the red line and red shade, indicating areas where selling pressure may arise to prevent further price increases. Traders often consider these levels as potential buying or selling opportunities.
Breakouts: Breakouts occur when the price convincingly moves above a resistance level (red shade) or below a support level (green shade). A bullish breakout above resistance suggests the potential for further price increases, while a bearish breakout below support suggests the potential for further price declines. Traders pay attention to these breakout signals as they may indicate the start of a new trend or significant price movement.
Disclosure: I am not SEBI registered. The information provided here is for learning purposes only and should not be interpreted as financial advice. It is important to consult with a qualified financial advisor before making any investment decisions. Tweets neither advice nor endorsement.
GRASIM GRASIM looks good for mid -term.
GRASIM BUY
CMP-1933
TARGET- 2000/2070/2200+
SL BELOW-1900
#MIDTERM

Grasim trade setupBroadning decending wedge is a bullish pattern
2 probabilities, one is beariah as we can see a divergence in RSI. Second one is bullish as this pattern is a bullish pattern.
Once the wedge is broken upside we get to see those targets .. or if it continues in the range we get to see the bottom support line as target but remember if it continues downside and did not break the lower low get ready for a breakout.

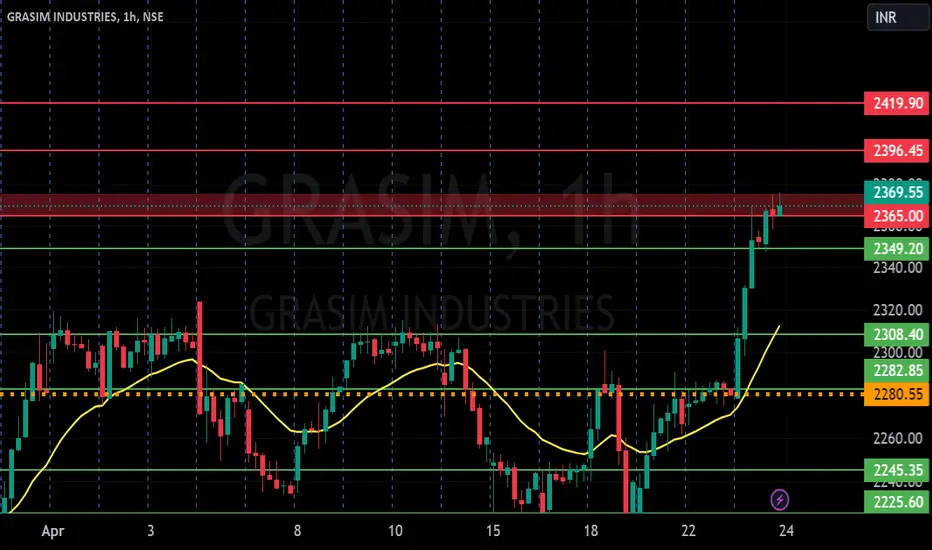
GRASIM INDUSTRIES S/R for 1/4/24Support and Resistance Levels: In technical analysis, support and resistance levels are significant price levels where buying or selling interest tends to be strong. They are identified based on previous price levels where the price has shown a tendency to reverse or find support.
Support levels are represented by the green line and green shade, indicating areas where buying interest may emerge to prevent further price decline.
Resistance levels are represented by the red line and red shade, indicating areas where selling pressure may arise to prevent further price increases. Traders often consider these levels as potential buying or selling opportunities.
Breakouts: Breakouts occur when the price convincingly moves above a resistance level (red shade) or below a support level (green shade). A bullish breakout above resistance suggests the potential for further price increases, while a bearish breakout below support suggests the potential for further price declines. Traders pay attention to these breakout signals as they may indicate the start of a new trend or significant price movement.
Disclosure: I am not SEBI registered. The information provided here is for learning purposes only and should not be interpreted as financial advice. It is important to consult with a qualified financial advisor before making any investment decisions. Tweets neither advice nor endorsement.

Grasim IndustruesHas given a long term trendline and Gann level BO at 2194 where SL can be placed just below this level
Can reach the marked targets as given in the graph.

GRASIMNSE:GRASIM
One Can Enter Now ! Or Wait for Retest of the Trendline (BO) Or wait For better R:R ratio
Note :
1.One Can Go long with a Strict SL below the Trendline or Swing Low of Daily Candle.
2. Close, should be good and Clean.
3. R:R ratio should be 1 :2 minimum
4. Plan as per your RISK appetite
Disclaimer : You are responsible for your Profits and loss, Shared for Educational purpose

Swing Trade - GRASIM📊 Script: GRASIM
📊 Sector: Textiles
📊 Industry: Textiles - Manmade
Key highlights: 💡⚡
📈 Script is trading at upper band of BB and giving breakout of it.
📈 MACD is giving crossover .
📈 Double Moving Averages are giving Crossover.
📈 Right now RSI is around 62.
📈 One can go for Swing Trade.
⏱️ C.M.P 📑💰- 2287
🟢 Target 🎯🏆 - 2410
⚠️ Stoploss ☠️🚫 - 2241
⚠️ Important: Always maintain your Risk & Reward Ratio.
✅Like and follow to never miss a new idea!✅
Disclaimer: I am not SEBI Registered Advisor. My posts are purely for training and educational purposes.
Eat🍜 Sleep😴 TradingView📈 Repeat 🔁
Happy learning with trading. Cheers!🥂

GRASIM SETUP The stock is coming out of consolidation and is expected to make a top around 2150-2300 levels as per the expectation and may correct too after completing the technical pattern. It is making an entry into paint business which can give some boost as things are speeding up. However a strict sl is recommended as per the market conditions

GRASIM--Demand ZoneA strong demand zone is created in this stock from 2060 levels,
immeditely sellers push the price downwards,now from demand zone price is moving upside,
if this demand breaks then price test the demand zone at 1960 levels.
so keep look for shortside in this stock.find short oppurtunities in this stock.
Drop base drop chances are more.

Grasim
An ascending triangle is a breakout pattern that forms when the price breaches the upper horizontal trendline with rising volume. It is a bullish formation. The upper trendline must be horizontal, indicating nearly identical highs, which form a resistance level.

GRASIMGiving another one Oppurtunites in buying side. Let see how it goes Expecting minimum 3-4 % move should test at least R3 in chart


GRASIM INDUSTRIES S/R for 8/1/24Support and Resistance Levels:
Based on the price action, you have to identify two significant levels: the red line acting as resistance and the green line acting as support. Additionally, there have marked red and green shades to represent resistance and support zones, respectively.
Support: The green line and green shade represent support levels. These levels are where the price tends to find buying interest, preventing it from falling further. Traders can consider these levels as potential buying opportunities.
Resistance: The red line and red shade represent resistance levels. These levels are where the price tends to encounter selling pressure, preventing it from rising further. Traders can consider these levels as potential selling opportunities.
Breakouts: If the price breaks above the resistance zone (red shade) convincingly, it may indicate a bullish breakout, and the price could move higher to the next resistance level. On the other hand, if the price breaks below the support zone (green shade) convincingly, it may indicate a bearish breakout, and the price could move lower to the next support level.
Keltner Channel:
The Keltner Channel is a technical indicator that uses an exponential moving average (EMA) to create an upper and lower channel around the price action. Traders can use this channel to identify potential long and short positions.
Long Position: If the price is above the upper line of the Keltner Channel, it may indicate a potential long opportunity, as it suggests the price is trading above the average range and might continue in an upward trend.
Short Position: If the price is below the lower line of the Keltner Channel, it may indicate a potential short opportunity, as it suggests the price is trading below the average range and might continue in a downward trend.
Disclosure: I am not SEBI registered. I just wanted to let you know that the information provided here is for learning purposes only. Please consult your financial advisor before making any decisions. Tweets neither advice nor endorsement.

Grasim -- Cup & handle and flag Grasim after good consolidation today grasim gived 3.4% up move maybe more upside moment still pending...
Technical ::-------
1) Cup and handle pattern
2) bullish flag
3) volume also good
up side target 1842 / 1933

GRASIM INDUSTRIES Support & ResistanceSupport and Resistance Levels:
Based on the price action, you have to identify two significant levels: the red line acting as resistance and the green line acting as support. Additionally, there have marked red and green shades to represent resistance and support zones, respectively.
Support: The green line and green shade represent support levels. These levels are where the price tends to find buying interest, preventing it from falling further. Traders can consider these levels as potential buying opportunities.
Resistance: The red line and red shade represent resistance levels. These levels are where the price tends to encounter selling pressure, preventing it from rising further. Traders can consider these levels as potential selling opportunities.
Breakouts: If the price breaks above the resistance zone (red shade) convincingly, it may indicate a bullish breakout, and the price could move higher to the next resistance level. On the other hand, if the price breaks below the support zone (green shade) convincingly, it may indicate a bearish breakout, and the price could move lower to the next support level.
Keltner Channel:
The Keltner Channel is a technical indicator that uses an exponential moving average (EMA) to create an upper and lower channel around the price action. Traders can use this channel to identify potential long and short positions.
Long Position: If the price is above the upper line of the Keltner Channel, it may indicate a potential long opportunity, as it suggests the price is trading above the average range and might continue in an upward trend.
Short Position: If the price is below the lower line of the Keltner Channel, it may indicate a potential short opportunity, as it suggests the price is trading below the average range and might continue in a downward trend.
Disclosure: I am not SEBI registered. I just wanted to let you know that the information provided here is for learning purposes only. Please consult your financial advisor before making any decisions. Tweets neither advice nor endorsement.