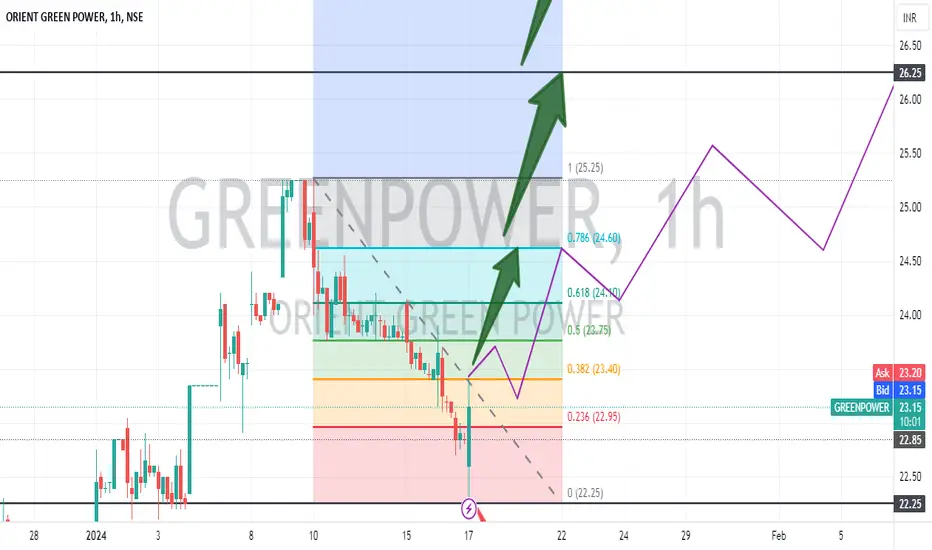
TIME TO PLUG INTO THIS ENERGY – GREENPOWER LOOKS LIT!Everything is pretty much explained in the picture itself.
I am Abhishek Srivastava | SEBI-Certified Research and Equity Derivative Analyst from Delhi with 4+ years of experience.
I focus on simplifying equity markets through technical analysis. On Trading View, I share easy-to-understand insights to help traders and investors make better decisions.
Kindly check my older shared stock results on my profile to make a firm decision to invest in this.
Kindly dm for further assistance it is for free just for this stock.
Thank you and invest wisely.
GREENPOWER trade ideas

A POWERFUL ENTRY INITIATED - GREEN POWER FOR YOUEverything is pretty much explained in the picture itself.
I am Abhishek Srivastava | SEBI-Certified Research and Equity Derivative Analyst from Delhi with 4+ years of experience.
I focus on simplifying equity markets through technical analysis. On Trading View, I share easy-to-understand insights to help traders and investors make better decisions.
Kindly check my older shared stock results on my profile to make a firm decision to invest in this.
Kindly dm for further assistance it is for free just for this stock.
Thank you and invest wisely.

GREENPOWER Consolidating 200MA for long time 200MA support - fundamentally, Greenpower is a future-growing sector in India. currently, a company is investing big money in a new plant in Tamilnadu.
We can expect a big move here.

orient green power orient green power in weekly time frame formed cup and handle but not breakout power stocks an excellent long-term investment with the support of 17 we can see 31 & 40
note add on dips

Technical Analysis of Orient Green Power Co Ltd (GREENPOWER)Technical Analysis of Orient Green Power Co Ltd (GREENPOWER)
Overview of the Stock - The provided chart presents a 1-hour timeframe for Orient Green Power Co Ltd (GREENPOWER) on the NSE. It includes price action, moving averages, Fibonacci retracement levels, and RSI.
Key Observations
Downward Trend: - The overall price action suggests a downward trend, indicated by the consistent lower highs and lower lows.
Support and Resistance: - The chart highlights potential support levels at the 0.236 Fibonacci retracement level (around 19.59 INR) and the 18-20 INR range, marked as the "Buy Zone." Resistance is evident at the 22.50 INR level and the 23.61 INR level (0.382 Fibonacci retracement).
Moving Average: - The 200-period EMA (Exponential Moving Average) is below the current price, indicating a potential bullish bias in the longer term. However, it's currently acting as resistance.
RSI (Relative Strength Index): - The RSI is below 50, suggesting that the stock is oversold. This could indicate a potential rebound or continuation of the downtrend.
Potential Trading Ideas (Based on Technical Indicators)
Conservative Approach: - Wait for a clear break above the 200 EMA or a sustained move above the 22.50 INR resistance level to confirm a potential bullish reversal.
Aggressive Approach: - Consider buying within the "Buy Zone" (18-20 INR) with a tight stop-loss below the recent low. However, be aware of the potential for further downside.
Additional Considerations
Remember: Technical analysis is a tool, not a crystal ball. It's essential to combine it with other factors like fundamental analysis and risk management for informed decision-making.
Disclaimer: - This analysis is based solely on the provided chart and technical indicators. It does not consider fundamental factors or market sentiment. Trading involves risk, and past performance is not indicative of future results. Always conduct thorough research before making investment decisions.

Orient Green Power Company LtdTarget and Stoploss in chart - Purely Technical and sector boom not to do anything with fundamentals
Market Cap
₹ 1,074 Cr.
Current Price
₹ 14
Stock P/E
51.8
Book Value
₹ 6.97
Dividend Yield
0.00 %
ROCE
7.15 %
ROE
1.82 %
Face Value
₹ 10.0
Promoter holding
32.5 %
EPS last year
₹ 0.43
EPS latest quarter
₹ 0.11
Debt
₹ 1,091 Cr.
Pledged percentage
100.0 %
Net CF
₹ 2.72 Cr.
Price to Cash Flow
4.69
Free Cash Flow
₹ 229 Cr.
Debt to equity
2.08
OPM last year
66.2 %
OPM 5Year
67.3 %
Reserves
₹ -227 Cr.
Price to book value
2.05
Int Coverage
1.22
PEG Ratio
3.17
Price to Sales
4.14
Market Cap to Sales
4.14

GREENPOWER - Orient Green Power - Buy & HoldOrient Green Power (GREENPOWER) Technical Analysis :- Here's a breakdown of some resources for you to analyze Orient Green Power's (GREENPOWER) technical:
Overall Analysis: :- As per previous chart history and pattern along with my personal opinion as a technical analysis, I suggest this stock to buy at CMP@20 or wait for a DIP
This is because all indicators show a mix of signals. There's a "sell" rating based on technical indicators, but some analysts see a potential cup and handle pattern indicating a rise.
Important Reminders:- Technical analysis is just one piece of the puzzle. Consider fundamental factors and news related to the company for a more comprehensive view.
No single indicator is perfect, and analysis can be subjective. Use these resources as a starting point for your own research.
Always set stop-loss orders to manage risk, regardless of the technical signals.
Disclaimer: I cannot provide financial advice because I am NOT SEBI registered. Do your own research before making any investment decisions.
Thanks for your support as always
GreenPower (GREENPOWER) Support and Resistance Levels
Here's a quick rundown on GreenPower's (GREENPOWER) support and resistance levels:
Current Price (as of June 7, 2024): ₹19.75 (according to Bazaartrend )
Short-Term Support: ₹19.1 (according to munafasutra )
Short-Term Resistance: ₹19.9 (according to munafasutra )
Additional Support Levels:
₹19.7 (5-Day Moving Average)
₹21.00 (Recent Support Level, may not hold)
Resistance Levels to Watch:
₹23.58 (Short-Term Stoploss for Sell Recommendation)
₹24.22 (20-Day Moving Average)
Remember:
These are just a few data points, and support and resistance levels can be dynamic.
Consider using charting tools to visualize these levels and recent price movements.

ORIENT GREEN POWERThis stock breakout major resistance level and TGT will be more then 50%
and this is only for educational purpose only

orient green powerthere are two patterns emerging...flag with a pennant and cup and handle for a medium target

GREENPOWER - Orient Green Power - An OverviewAs per previous chart history and technical analysis along with Fundamental inputs of the stock, it indicates that you can buy or hold your stock for profit in short term as per chart analysis.
Wait for reversal for better entry or Buy above 23.50 and safe Buying above 25 and hold for big profit.
If broken downward, a big bearish trend is seen on the downside chart
All major points & downward levels mentioned on chart
Do your own research because I am not SEBI registered person and this is my personal opinion about this stock
Thanks for your support as always
Orient Green for Swing/Positional Orient Green Power Prediction for Swing/ Positional Trading
You can enter into trade above Entry level (14.70) daily close basis or after 15.6 safely CMP is 14.35 . There is a resistance 15.10-15.6 level. You take it purely on long positional basis also.
Strong Supports are shown in the chart.
Targets- 16,20,30,40,.. (more will be updated later)
Intermediate Targets- See Chart
According to your “STOMACH” book your profit. Always maintain your risk management.
Watch Carefully – The Chart Explains For Itself.
Disclaimer:
I am not a SEBI Registered Analyst. Anything posted here is my own analysis and views. This is created for educational purposes only. Always consult your Financial Advisor before taking any decision or trade.
Request: Please support by Like, follow, comment, share and boost.
Happy trading.
About Orient Green Power –
Orient Green Power Co., Ltd. engages in the production and distribution of renewable energy. It focuses on the development, ownership, and operation of wind energy power plants located in the states of Tamil Nadu and Andhara Pradesh. The company was founded by Thyagarajan Shivaraman in October 2006 and is headquartered in Chennai, India.
You can follow me in social media through links given below-


GREENPOWER BUY3T VCP characteristics!
Prior Uptrend of 48%
Expecting it to go near 15, and then 5-6% bearish movement.
Add at that time, Entry near 14.10-13.80.
SL - 13.50 AFTER YOU ENTER!
TIMEFRAME - 10-15 DAYS
LET IT TRIGGER BEFORE ENTERING

orient green power.is an excellent buy ideathe stock is at confluence support of channel top edge, 8 and 21 ema and in addition hidden divergence................stock can be bought for a target of 24.85

Green PowerOrient Green Power Co., Ltd. engages in the production and distribution of renewable energy. It focuses on the development, owning, and operation of wind energy power plants located in the states of Tamil Nadu and Andhara Pradesh. The company was founded by Thyagarajan Shivaraman in October 2006 and is headquartered in Chennai, India.
NOT A SEBI REGISTERED TRADER ONLY FOR EDUCATIONAL PURPOSES.

Orient Green Power - LongOrient Green Power CMP - 3.45
Looking bullish in higher time frame. One can go for Short Term Trade setup with the following entry, exit & targets
Buy Range 3.45 - 3.75 / Stop Loss 2.40
Target 1 - 5.50
Target 2 - 6.50
Target 3 - 7.50
Disclaimer: This is my view and for educational purpose only.


Orient Green Power Triple Bottom on weekly chart @ 7.90, Since 2012 Stock running in same pattern buy with a target 11,12 above that ultimate Target 16 Sl 9.50
