50 SMA Rising- Positional TradeDisclaimer: I am not a Sebi registered adviser.
This Idea is publish purely for educational purpose only before investing in any stocks please take advise from your financial adviser.
Its 50 SMA Rising Strategy. Suitable for Positional Trading Initial Stop loss lowest of last 2 candles and keep trailing with 50 days SMA if price close below 50 SMA then Exit or be in the trade some time trade can go for several months.
Be Discipline because discipline is the Key to Success in the STOCK Market.
Trade What you see not what you Think
GUFICBIO trade ideas

GUFICBIOGUFICBIO
daily timeframe
i just shared my experience it is not an invite or recommendation to trade.
if youn any doubt means Please leave comments for any query.
best wishes
DYSON

50 SMA Rising- Positional Tradeisclaimer: I am not a Sebi registered adviser.
This Idea is publish purely for educational purpose only before investing in any stocks please take advise from your financial adviser.
Its 50 SMA Rising Strategy. Suitable for Positional Trading Initial Stop loss lowest of last 2 candles and keep trailing with 50 days SMA if price close below 50 SMA then Exit or be in the trade some time trade can go for several months.
Be Discipline because discipline is the Key to Success in the STOCK Market.
Trade What you see not what you Think

GUFIC BIOSCIENCES LTD S/RSupport and Resistance Levels:
Support Levels: These are price points (green line/shade) where a downward trend may be halted due to a concentration of buying interest. Imagine them as a safety net where buyers step in, preventing further decline.
Resistance Levels: Conversely, resistance levels (red line/shade) are where upward trends might stall due to increased selling interest. They act like a ceiling where sellers come in to push prices down.
Breakouts:
Bullish Breakout: When the price moves above resistance, it often indicates strong buying interest and the potential for a continued uptrend. Traders may view this as a signal to buy or hold.
Bearish Breakout: When the price falls below support, it can signal strong selling interest and the potential for a continued downtrend. Traders might see this as a cue to sell or avoid buying.
20 EMA (Exponential Moving Average):
Above 20 EMA(50 EMA): If the stock price is above the 20 EMA, it suggests a potential uptrend or bullish momentum.
Below 20 EMA: If the stock price is below the 20 EMA, it indicates a potential downtrend or bearish momentum.
Trendline: A trendline is a straight line drawn on a chart to represent the general direction of a data point set.
Uptrend Line: Drawn by connecting the lows in an upward trend. Indicates that the price is moving higher over time. Acts as a support level, where prices tend to bounce upward.
Downtrend Line: Drawn by connecting the highs in a downward trend. Indicates that the price is moving lower over time. It acts as a resistance level, where prices tend to drop.
RSI: RSI readings greater than the 70 level are overbought territory, and RSI readings lower than the 30 level are considered oversold territory.
Combining RSI with Support and Resistance:
Support Level: This is a price level where a stock tends to find buying interest, preventing it from falling further. If RSI is showing an oversold condition (below 30) and the price is near or at a strong support level, it could be a good buy signal.
Resistance Level: This is a price level where a stock tends to find selling interest, preventing it from rising further. If RSI is showing an overbought condition (above 70) and the price is near or at a strong resistance level, it could be a signal to sell or short the asset.
Disclaimer:
I am not a SEBI registered. The information provided here is for learning purposes only and should not be interpreted as financial advice. Consider the broader market context and consult with a qualified financial advisor before making investment decisions.

Parallel channel Breakout is possible in GUFIC BIOSCIENCES
Parallel channel Breakout is possible in GUFIC BIOSCIENCES

50 SMA Rising- Positional TradeDisclaimer: I am not a Sebi registered adviser.
This Idea is publish purely for educational purpose only before investing in any stocks please take advise from your financial adviser.
Its 50 SMA Rising Strategy. Suitable for Positional Trading Initial Stop loss lowest of last 2 candles and keep trailing with 50 days SMA if price close below 50 SMA then Exit or be in the trade some time trade can go for several months.
Be Discipline because discipline is the Key to Success in the STOCK Market.
Trade What you see not what you Think

Gufic can make moves terrificGufic Biosciences Ltd. company was founded on July 23, 1984 and is headquartered in Mumbai, India is engaged in the manufacture of pharmaceuticals, medicinal chemicals and botanical products. It operates through the following geographical segments: India, Africa, Asia, Europe, North America, Australia and South America.
The Negative aspects of the company are High Valuation (P.E. = 38.20), Declining annual net profit, declining cash from operations annual and FIIs are decreasing stake. The positive aspects of the company are Low debt, Zero promoter pledge, MFs are increasing stake and Promoter holding increasing.
Entry after closing above 325. Targets in the stock will be 336 and 344. Long term targets in the stock will be 357 and 365. Stop loss in the stock should be maintained at closing below 292.
The above information is provided for educational purpose, analysis and paper trading only. Please don't treat this as a buy or sell recommendation for the stock. We do not guarantee any success in highly volatile market or otherwise. Stock market investment is subject to market risks which include global and regional risks. We will not be responsible for any Profit or loss that may occur due to any financial decision taken based on any data provided in this message.

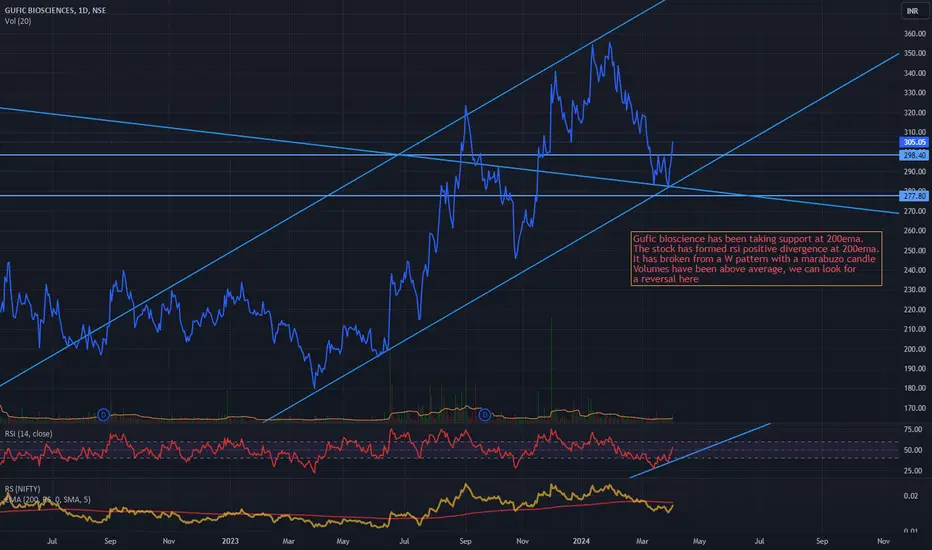
Gufic bioscienceThe stock has been in a Uptrend. Rsi divergence and breakout from w pattern with a marabuzo candle and good volumes give a possibility of reversal.
Gufic bioA cup and handle is considered a bullish signal extending an uptrend, and it is used to spot opportunities to go long. Technical traders using this indicator should place a stop buy order slightly above the upper trendline of the handle part of the pattern.

Gufic Bio Science- Nice BreakoutGufic Bio Science- Nice Breakout
Capital to be deployed- 20k
Investing Price -282-284
Breakout Price -280
Stoploss -236
Targets-341-410-601
RT for max reach
#guficbio #StocksToBuy #stocks #stockstowatch #StocksToTrade #SwingTrading

Gufic Biosciences Fundamentally decent pharma stock looks bullish on all the major time frames after breaking out of the Gann box
SL- 237


#GUFICBIO #ZYDUSWELL #FORTIS #AARTIDRUGS #ALKEM #GLAND #BIOCON #GUFICBIO
NSE: GUFICBIO
CMP: 227
TP: 270
SL: 205
TF: <6m
RR > ~2 times
Return > 18%
GUFICBIO THYROCARE CNXPHARMA LUPIN SUNPHARMA SPARC DIVISLAB DRREDDY AUROPHARMA BALPHARMA GLENMARK SANOFI PFIZER BPLPHARMA MARKSANS BIOCON GRANULES IPCALAB LAURUSLABS NATCOPHARM GLAND ALKEM ZYDUSLIFE APOLLOHOSP FORTIS AARTIDRUGS ZYDUSWELL MAXHEALTH BAJAJHCARE
Factors:
BULLISH WEDGE BREAKOUT
Trend Following
Rising Volume with rising Prices.
Flag pattern breakout.
Pennant Pattern Breakout with Bullish Candle.
Retest Successful.
Higher Highs & Higher Lows.
Broken above RESISTANCE levels
Trading at SUPPORT levels
Earnings are strong.
Bullish Wedge Breakout
Risk Return Ratio is healthy.
And
Rising from Double Bottom Pattern to Flag Pattern forming.
If you like my work KINDLY LIKE SHARE & FOLLOW this page for free Stock Recommendations.
With 💚 from Rachit Sethia


Fresh UpmoveAs long as 208 is held, we can safely say that the 3rd wave has started.
Expecting the 3rd to be subdivided again in 5-3-5-3-5 structure to reach equality to 1 at 255
Lets see how this develops


GUFICBIOSCIENCEDOW Theory higher high and higher top formation
equity 10 cr promoters holding
promtors holding 75% increased in a year from 65%
good support from trendline

Gufic Bio IndiaSun Storm Investment Trading Desk & NexGen Wealth Management Service Present's: SSITD & NexGen Portfolio of the Week Series
Focus: Worldwide
By Sun Storm Investment Research & NexGen Wealth Management Service
A Profit & Solutions Strategy & Research
Trading | Investment | Stocks | ETF | Mutual Funds | Crypto | Bonds | Options | Dividend | Futures |
USA | Canada | UK | Germany | France | Italy | Rest of Europe | Mexico | India
Disclaimer: Sun Storm Investment and NexGen are not registered financial advisors, so please do your own research before trading & investing anything. This is information is for only research purposes not for actual trading & investing decision.
#debadipb #profitsolutions

GUFIC BIOSCIENCES 1:3 🎯50% trade.NSE:GUFICBIO Broke out of rectangle consolidation pattern and now price gave retest + confirmation.
Bullish signs-
Big volumes on breakout and on the buy side.
Price entered virgin territory with this consolidation and breakout.
Recent support from 30 week MA.
Low volume red candles.
Pattern is of a bullish flag type.
Stock has already delivered multibagger returns of 2000%.
One can enter entre position at C.M.P with a big sl in view of a taking a positional bet for next 1-6 months.
Targets: 275/320/375/400+
Place wide sl below 200
Trail sl if trade goes our way.
Position size accordingly. HAPPY TRADING!

breakout after 8 month consolidation.expected to go 18-20%
red lines as SL
Disclaimer:- This is only for educational purpose.


