Happiest Minds Technologies LtdThis chart is only for educational purposes and should not be considered for doing any buying and selling in this stock.
HAPPSTMNDS trade ideas

please guys don't close HAPPSTMNDS into hit TP patience is key guys
this trade was first trade i have been posted in my page so it must make us money lol
ALHAMDULILAH


Bought Happiest Mind - Long Term HoldingThis is my experience with share of Happiest Mind.
I first heard about Happiest Minds at the time of its Initial Public Offer (IPO), watched other people research video on YouTube and liked the Company's Idea and overall business and applied for IPO at a price of Rs. 166 per share for 90 shares that is Rs. 14,940 worth of Investment. The share had huge subscription (151 times) and other overall good factors consequently the share listed at Rs. 350 per share. (whooping 111% premium). After such a huge listing lot of short term investors exited from this share (People who solely invest for the purpose of listing gains). Later was keeping a track of the share however didn't have enough faith to enter reason being share has already doubled and hence kept postponing the decision to buy the share.
Few days later, the share started forming Channel Pattern, and every time it use to break the Channel with a huge gain. It formed another channel pattern after the first one. At the third channel pattern formation I gathered enough faith and entered at a price of Rs. 844 and guess what it broke the channel pattern and is now at Rs. 1,494 (16th July, 2021 Market Closing Price)
Note: Every time it breaks the channel pattern it also some other catalyst to support the break (For Example: Quarterly Earnings Report)
Have invested in this share for a longer term not planning to sell it any time soon.
Comments on the post are welcomed.


Happiest Minds Technologies LtdThis chart is only for educational purposes and should not be considered for doing any buying and selling in this stock.

Happiest MindEntry 1120
Exit 1838
SL 813
Duration 3 Months
Info is just for educational purpose...Trade at your own risk....

HAPPIESTMINDS SHORT TO MEDIUMHappiest Minds is performing really well and it should form another triangle and make a high of 1000 in this month, so it seems to be a good buy for short to medium period.


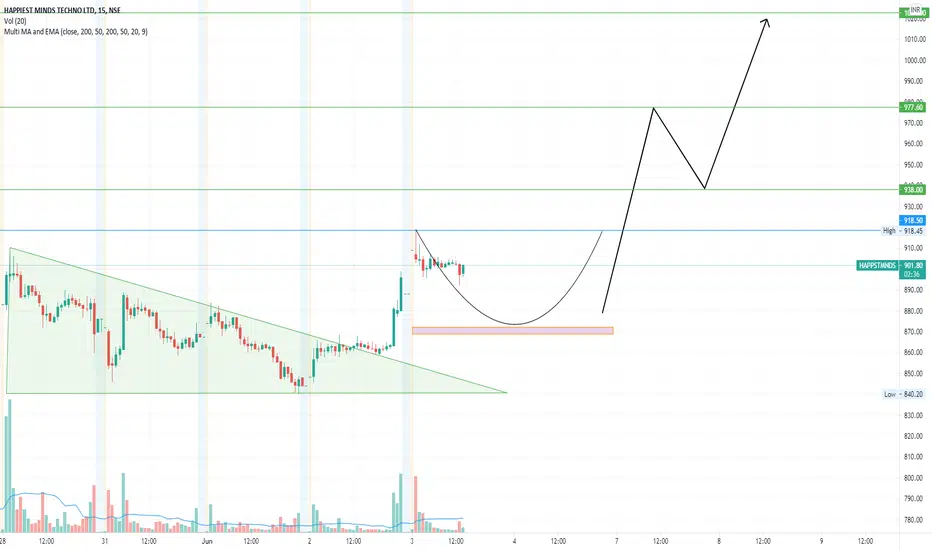
HAPPIEST MINDS 15MINHAPPIEST MINDS gave a breakout after making a triangle pattern. Currently making a cup correction can buy after the blue line and targets are the green lines.
Buy at Dips, Long on Happiest MindsSome weakness before breakout
Can test 800 or 830, can buy at these levels with trailing stop loss at 770 to 780
First Target – 930
Second Target – 960
Once breaks 965, more breakout expected.
Buy Every dip, 750 shows major support, short below 750
Comfortable RSI and good Fundamentals

HAPPIEST MINDS 15MINHAPPIEST MINDS can buy after the breakout of the triangle pattern. Green lines are the targets as well as the supports in downside.

Happiest Minds breaking the resistance and shooting upRecently broke 774 resistance and moving up with multiple support points from the trendline


Happiest Minds Technologies Ltd.This chart is only for educational purposes and should not be considered for doing any buying and selling in this stock.


HAPPSTMNDS LONG INTRADAY 23 APR, 2021Dear trader,
If u look at the chart of HAPPSTMNDS (analysis based intraday only) the HAPPSTMNDS Buy at 645 and
Target at 655
Best Buy at 639
Our Best Buy is based on high quality research and when the instrument reaches this level , it’s a jackpot trade.
Best Buy level might be executed or might not be executed.
The chart clearly indicates Bullish Trend you can also see the candle stick patters for more indepth analysis.
In Intraday most important thing is to enter and exit points.
Our signals are based on analytics, algorithms, mathematical derivatives.
Always be a responsible trader, kindly trade only when you have maximum opportunity in the market with minimum risk and with keynotes like data, analysis and proper strategies.
Kindly message us for strategies and analysis.

Happiest Mind - Not so happy?A good tech company with lot of potential but price needs some correction at this moment
RSI - On daily chart bearish divergence can be seen.
A bearish flag like pattern is also formed on the daily chart.
Fib levels are provide for targets.
Above ideas are for learning purpose only. Please do your own research before taking any trade.

