HCLTECH trade ideas


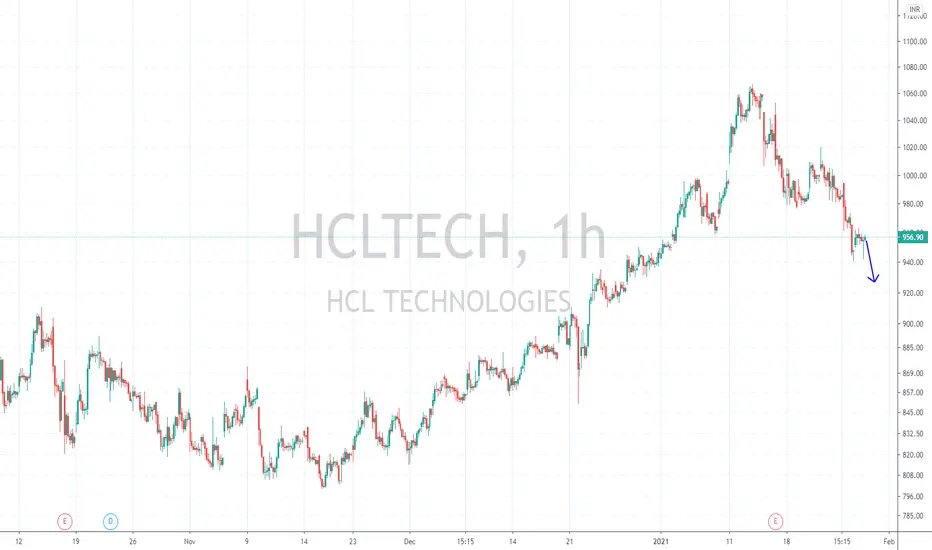
HCLTECH - Intraday Trade SetupHCL Tech Tv CMP - 955.50
Looking bearish in higher time frame. One can go for Intraday Trade setup with the following entry, exit & targets
Sell at or Below 941 ONLY / Stop Loss 961
Target 1 - 936
Target 2 - 931
Target 3 - 926
Disclaimer: This is my view and for educational purpose only.

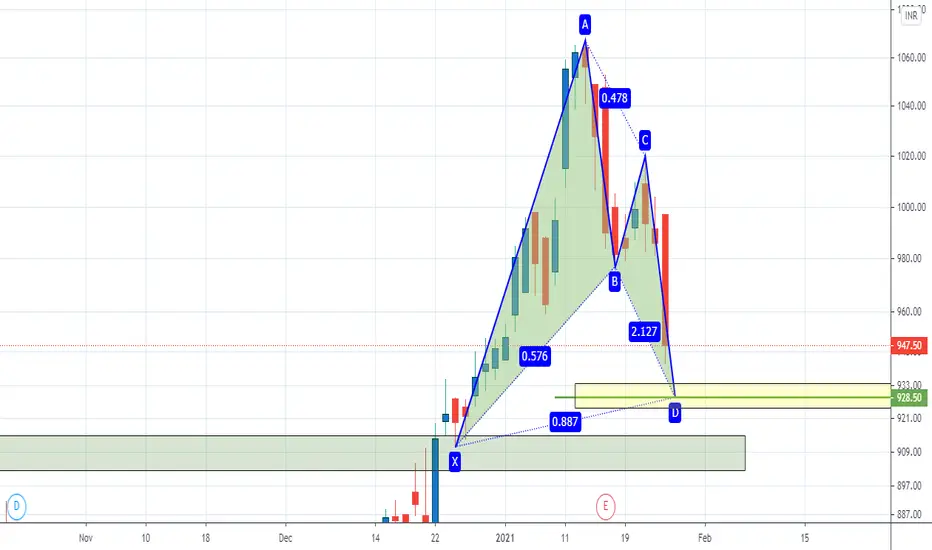
Can this find support here if u find Reversal Patterns around the buying zone..,,...One can go long here with 900 as SL

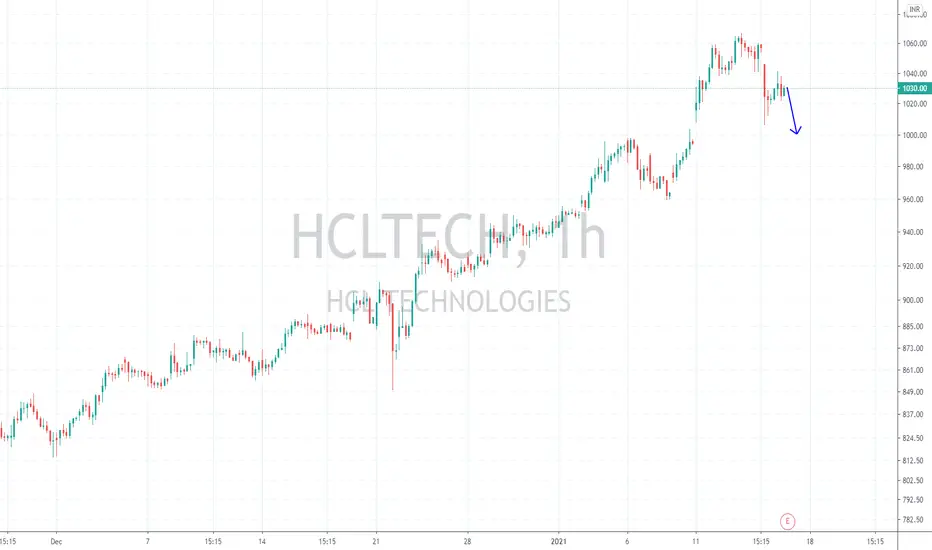
HCLTECH - Intraday Trade SetupHCL Tech CMP - 1027.70
Looking bearish in higher time frame. One can go for Intraday / Swing Trade setup with the following entry, exit & targets
Sell at or Below 1024 / Stop Loss 1033
Target 1 - 1020
Target 2 - 1015
Target 3 - 1010 / 1000
Disclaimer: This is my view and for educational purpose only.


HCL Technologies Retesting the trend lineNSE:HCLTECH
The TrendLine acted as a Resistance before the breakout
Now the TrendLine is acting as a support
Buy if the price sustains above the trendline
SL @ 964
T@rget @ 1010

HCL Tech Chart analysis targets towards 1125This analysis shows how HCL tech movement works in zones.

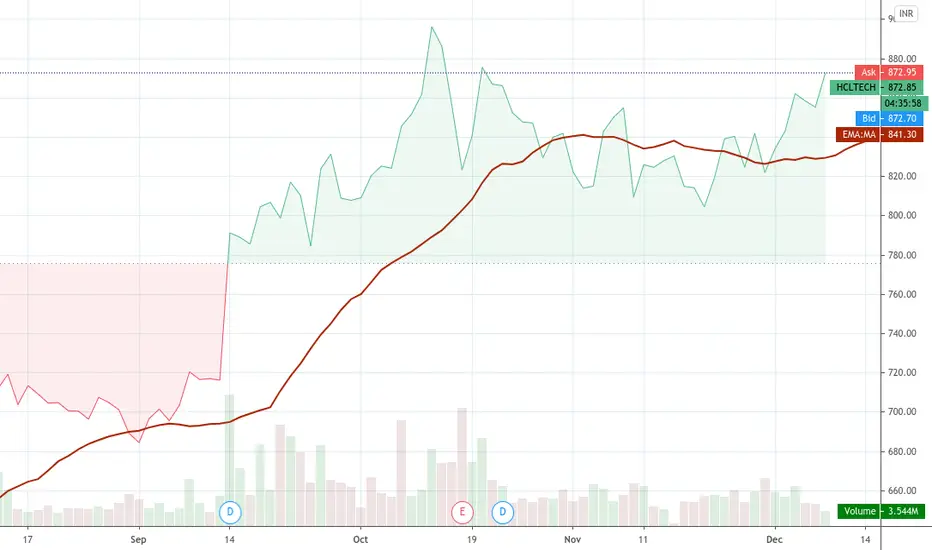
Buy HDCTECH positionallyHCL TECH is looking strong on Charts and IT sector itself is in Uptrend. Previous shorterm resisitance also acting as a good support.
(Note:- This is my personal views. Please consult with your financial advisor before taking trade.)

HCLtech 15 min analysisHCLtech making all time high.. as shown in chart after triangle breakout it can start its rally up
Chart is only for educational purpose, not a trading recommendation...

HCLTECHI'm not an expert I'm just sharing my views on HCLTECH for next trading day
I'm not responsible for any profit or loss this is not a recommendation.


A good setup spotted in HCL TECHBuy HCL Tech on swing basis trade for a good target in coming days. SL is close so risk is very small in front of reward.
(Note:- This is my personal views. Please consult with your financial advisor before taking trade.)

HCLTECH already broke out from falling wedge 1hr time frameHCLTECH already broke out from falling wedge 1hr time frame, now trading at hourly time frame support its for bit long term

HCL - Retesting support after breakoutHCLTECH has given breakout and now taken a support from its previous resistance level.
High chances that in first hour on 8th December, it may come to its support again and carry on it upmove. Not a bad price to go long.(short term)
