HCLTECH at a Crucial Fibonacci Level.The LAST CLOSE PRICE of NSE:HCLTECH is 858.5 . The PARABOLIC SAR is showing the UPWARD SIGNAL with TREND as UPTREND . The FIBONACCI LEVELS analysis shows that the CLOSEST FIBONACCI LEVELS is 0.5 at the FIBONACCI STOCK PRICE LEVEL of 855.48 . From here, the Key Support and Resistance levels are SUPPORT 1 at 250.07 , SUPPORT 2 at 826.32 with RESISTANCE 1 and RESISTANCE 2 at 868.51 and 887.05 respectively. The Key 50% FIBONACCI LEVEL stands at 855.48 which is the crucial Fibonacci Level determining whether the scrip will maintain the trend or not.
The STOC RSI has the values K and D as 97.39 and 88.51 respectively. At this level it the status is OVER BOUGHT . When we look at the Moving Averages, MACD is the crucial indicator to look into. With MACD VALUE at 5.05 and at 1.51 alongwith HISTOGRAM showing valus of 3.54 , the STATUS is clearly UPWARDS .
The best indicator to determine the Trend Reversal is FISHER TRANSFORM and currently the values of FISHER and TRIGGER stand at 1.17 and 0.74 with as UPTREND . A very important factor while making the investment is to see if there has been already too much Buying or Selling, and that are we entering too late into the transaction or not. Thus, with WILLIAM's R% value at -0.1338 the STATUS is OVER BOUGHT .
No one wants to buy costly things, and thus always look for the bargain or appropriate price levels to buy things. The same applies to Stocks, however the only exception would be some Hot Stocks that one wants to have any price. Looking at this perspective, the P/E RATIO of the stock stands at 19.095 which signifies its Price Level to be AVERAGE .
Disclaimer:
The analysis is only for illustration purposes only. Please consult your financial advisor, agent, broker before acting on any information. We may or may not have positions in the stock and our actions may be contrary to the one mentioned here. This analysis may or may not be updated. We would not be responsible for the profit/loss resulting from this analysis.
HCLTECH trade ideas


HCLTECH - Bullish H&S Pattern - Intraday/Short Term TradeThis analysis is purely based on price action and Chart Patterns.
The analysis is on 15min TF hence target can be achieved in intraday trade or in couple of days
Trade strategy is explained in image itself. Don't chase the price.
Always plan your trade & trade your plan
Keep trailing SL accordingly once entered into the trade.
Trade at your own risk and money management. Do your own study before taking any trade
Feel free to comment for any queries & suggestion

HCLTECHHCLTECH is weak below 795
These idea's are not my recommendation. Do your own analysis before making any trade based on this idea.

HCLTECH - Bull Flag & Inverted H&S - Short Term tradeThis analysis is purely based on price action and Chart Patterns.
The analysis is on 15min TF hence target can be achieved in intraday trade or in couple of days
Trade strategy is explained in image itself. Don't run after the price.
Always plan your trade & trade your plan
Keep trailing SL accordingly once entered into the trade.
Trade at your own risk and money management. Do your own study before entering into any trade.
Feel free to comment for any queries & suggestion


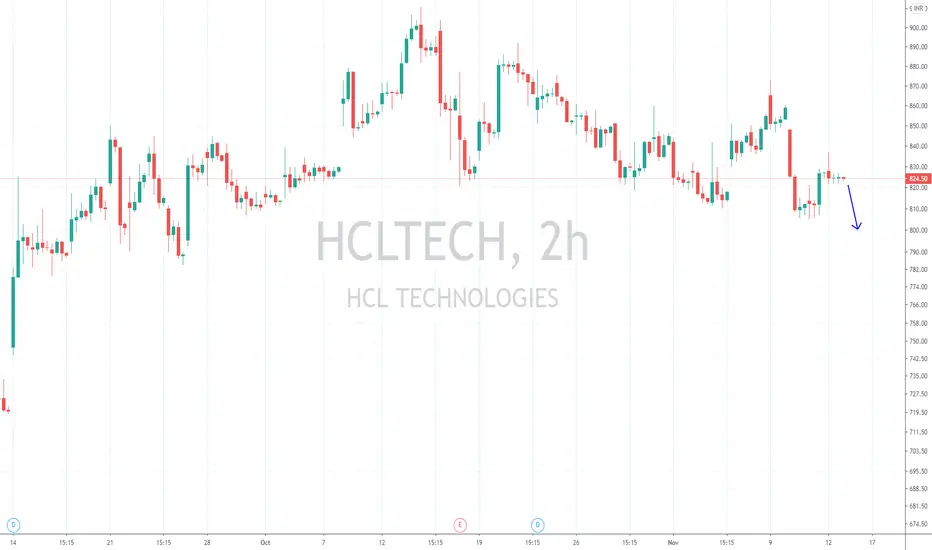
HCLTECH - ShortHCL Tech CMP - 824.70
Looking bearish in higher time frame. One can go for Intraday / Swing trade setup with the following entry, exit & targets
Sell at or Below ONLY 819 / Stop Loss 827
Target 1 - 815
Target 2 - 810
Target 3 – 805 / 800
Disclaimer: This is my view and for educational purpose only.

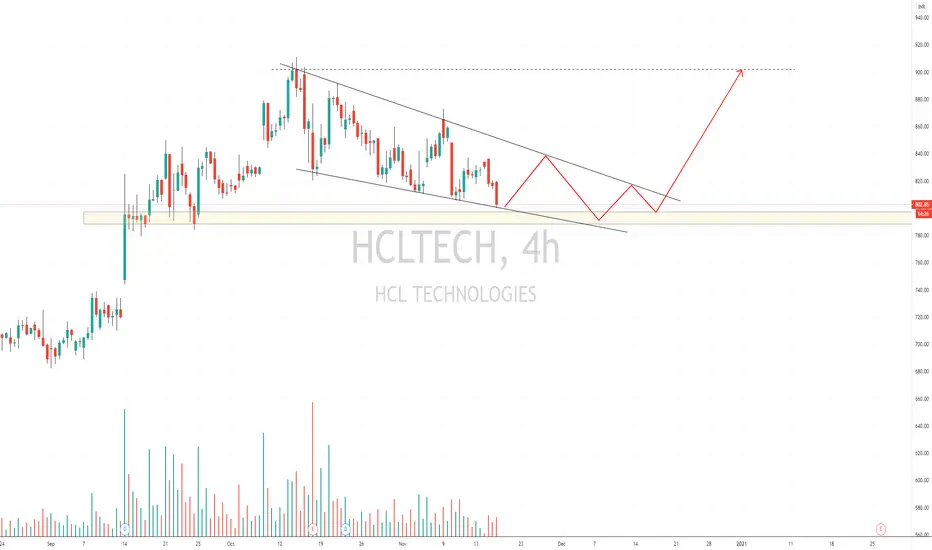
HCL Tech (A Rally coming to a close ?)The IT sector has been on a major bull run yet again with the world becoming more Tech dependent following the Pandemic. HCL Tech has been a major contributor to the rally in the Indian IT space. However for a while now the stock has been consolidating hence forming a triangle supported by the 50 EMA o the support area of the triangle.
There is an interesting study on the stock. If you would see the spaces marked with the Green arrows, you would see how the stock continuously formed higher highs while the RSI formed lower/similar highs. This formation is generally regarded as a Bearish Divergence indicating a reversal in trend, however the price never confirmed to such a move because it never formed a lower low as indicated by the blue arrows. Even now within the triangle the stock has formed a higher low and is now reversing looking for a breakout to the upside. Any breakout might see the stock taking off it's all time high forming yet another Higher High and continuing the uptrend. However in case the stock breaks to the downside forming a lower low then we might see some downward pressure continuing as it will indicate towards a temporary end to the uptrend.
Things have started to turn towards the positive side, with many things working in India's favour like Increasing growth forecasts by different brokerage / research houses, companies delivering better than expected numbers for Q2, the expectation of having a vaccine soon has brought the Index to its all time high and things are just looking better. However we need to keep in mind that the markets are going up only on the expectation that things will be better, We need to see that even though the numbers for a lot of companies have improved they are still lagging the previous year on a half yearly basis and might de grow on a yearly basis as well, which clearly shows the valuations getting stretched even further. Volatility is here to stay until things don's look certain.
So trade with caution and never over expose.


HCL tech Can go down from here. First stop will be 806In weekly charts RSI is very high.
Bearish Engulfing pattern formed with heavy volumes.
As per Fibo Retracement 785 should be on the cards..


Triangle pattern breakout tomorrow -15 minutes chartWatchout for triangular pattern breakout tomorrow.


HCLTECH - Intraday/Very Short Term TradeThis analysis is purely based on price action.
The analysis is on 15min TF hence target can be achieved in intraday trade or in couple of days
Trade strategy is explained in image itself. Don't run after the price.
Always plan your trade & trade your plan
Keep trailing SL accordingly once entered into the trade. Due to US-Elections, Extreme volatility is expected in IT Stocks hence trade cautiously.
Trade at your own risk and money management
Feel free to comment for any queries & suggestion

HCLTECH - Elliott wave analysis - choppy HCLTECH - It has completed ABC flat correction as the part of complex WXY. Now X wave is in progressing. So wait for X wave to finish higher around 880 or above. Thereafter Y wave will again start bear cycle downside.
Give thumbs up if you really like the trade idea.


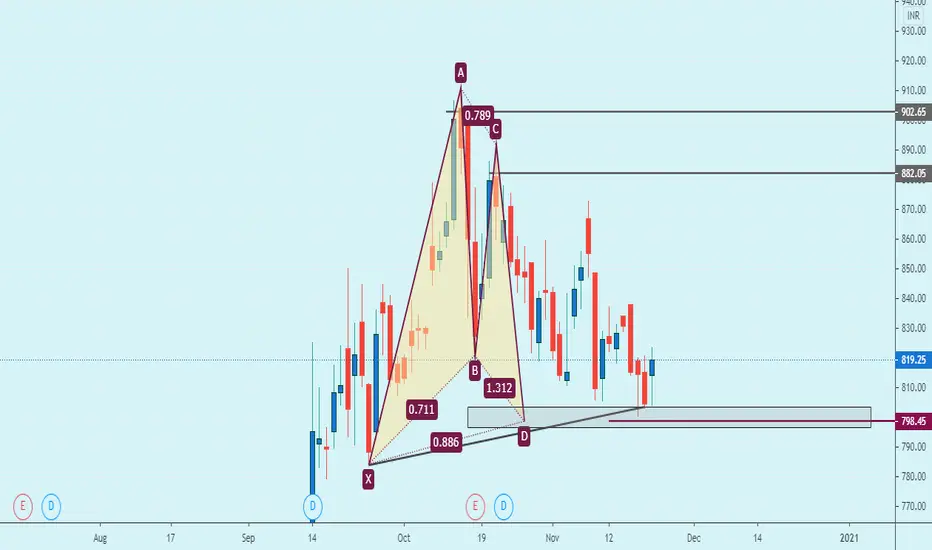
HCLTECH (NSE) - Elliott wave analysis HCLTech - It is in C wave down in ABC cycle after impulse cycle ended at new high. Sell with stop loss above 892.20 in bounce near 870-80 zone with small quantity for target up to 820-800 lower.
