HCLTECH : 27 AUG 20:WHAT TYPE OF PATTERN THIS IS?
SEE ALL MY CHARTS IF THEY ARE A KNOWLEDGE SEEKERS OPPORTUNITIES THEN LIKE MY CHARTS BECAUSE THEY ONLY ARE THE MOTIVATION FOR KNOWLEDGE HUNTERS.
HCLTECH trade ideas

HCL Very Strong Up Move HCL After major Breakout now conlidation is going on Once Breaks above 720 we can expect some strong rally towards 780 & 840 levels in short term.

HCL TECH : 24 AUG 20 : RECORD HIGH RATERECORD HIGH RATES, BE CAUSTIOUS, BEWARE OF BEARS FOR EVERY BULL. MARKET EXPECT TO CORRECT THE STATEMENT BY RBI GOVERNOR ON SATURDAY NIGHT.
MY SINCERE THANKS TO:
TRADING PANTHULU,
ACHARYA DEVO BHAVA.
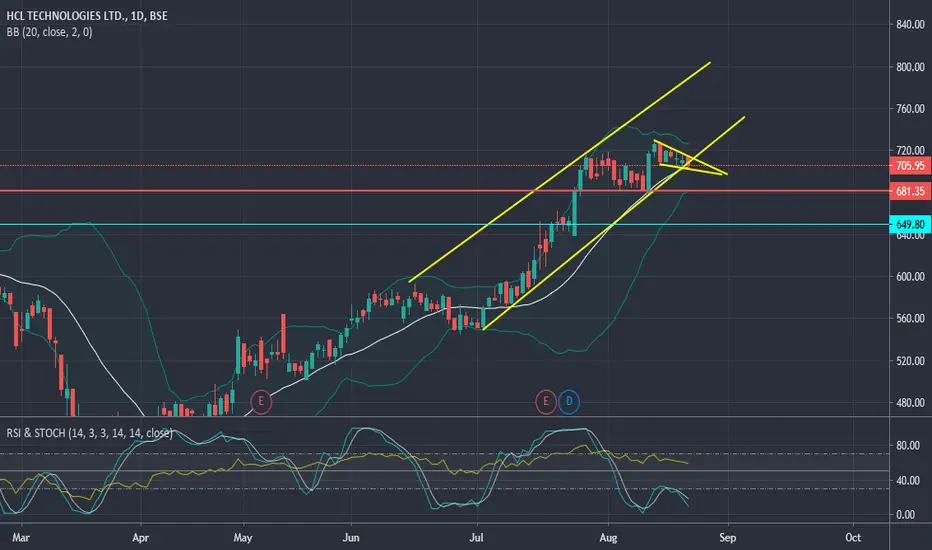
Will HCLTECH gives a BreakOut or BreakDown ?Consolidating from the last 3 day ,We saw Multiple Rejections from support level and TL resistance as encircled, Let's see how the market reacts. It will be a good bull run if it breaks 716 Levels.


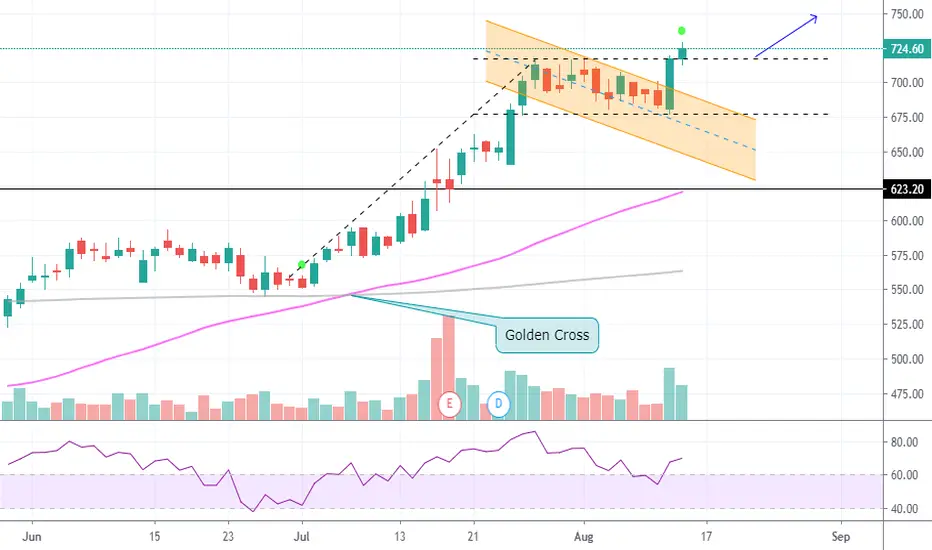
HCL TECHNOLOGIES - Fresh rallyAfter the Golden Crossover, the stock kept climbing and then moved in a 'Parallel Channel' while also forming a 'Flag' .
Yesterday's candle was a breakout with good Volume.
Today the close above the resistance has confirmed the strength.
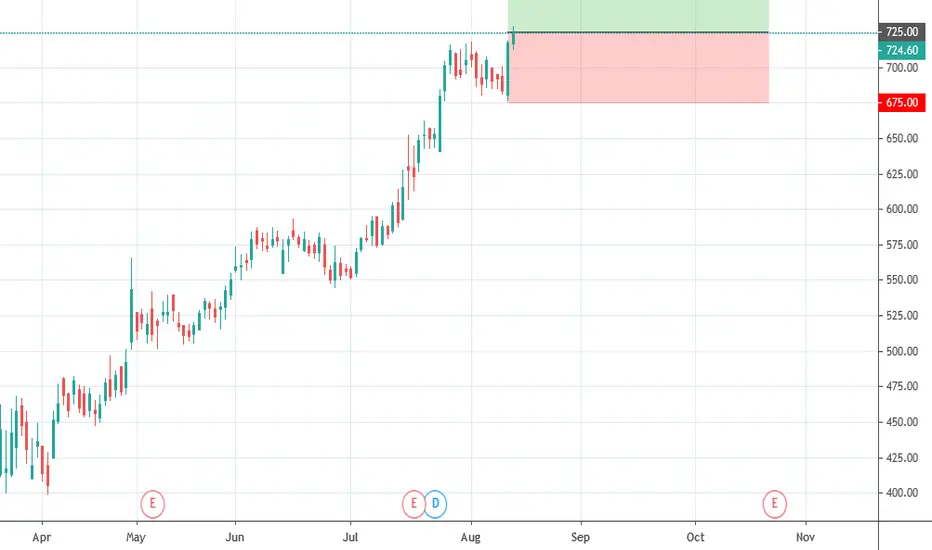
HCLTECH daily/ hourly/15min long 696 & 684 sl 675HCLTECH daily/ hourly/15min long 696 & 684 sl 675
Pro:
1. 2 excitig candle in 15 min(execution), 60 min
2. very clear zone
3. coinciding 15 and 60 min in location daily zone
4. stock is uptrend after breaking all time high for few weeks


enter in hcl on trendline breakout 8/19/2020 11:42 amwait for the trendline break and enter
in last post i made a mistake typo error kindly correct zeel to sunpharma


HCLTECH LONGHCLTECH CMP 717 LOOKS GOOD FOR ANOTHER BULL RUN SMALL RESISTANCE AT 730 760 AFTERWARDS BULL RUN TILL 830 SUPPORT PLACED AT 675

bullish on this shareHCL TECH IS BULLISH
BUY ABOVE 718
SL 700
TARGET 735-750
IT GAVE A BREAKOUT OUT !

Hcl Tech Decision PointHcl Tech is at control price of daily channel.
Its a decision point. Can move bothways
Shall wait up and see next week.
I expect it to move upside..
Lets roll..

Once they Break the Trend, They Break the TrendDon't go short today, it's the possible move in coming months as long as HCLTECH stays 800 and breaks the uptrend with an Impulse, we can see downside in HCLTECH


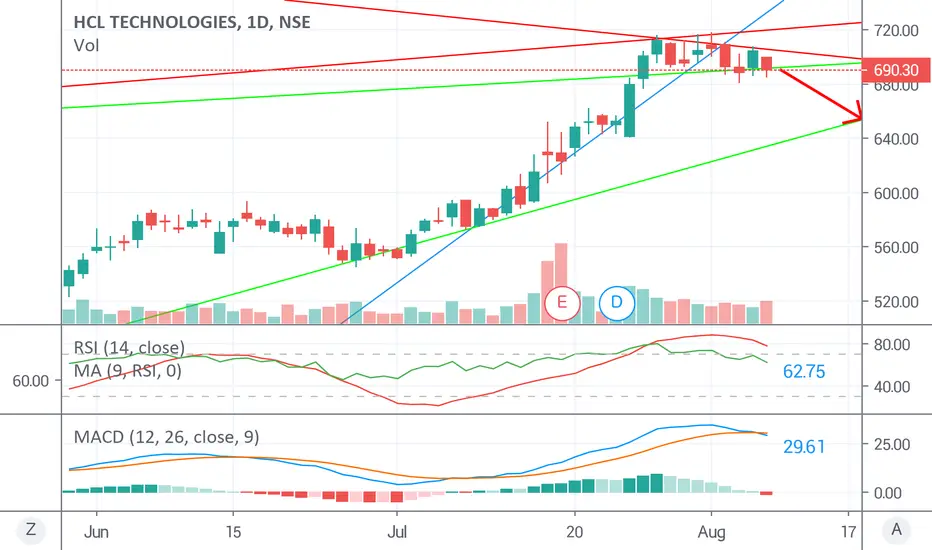
#HCLTECH #SHORT 10 AugustHCLTECH in downtrend as per Trendline , RSI , MACD and MA as well so it is strong bearish, RSI 14- 62.75, MACD- 29.61 in downward, so we can go for short on 10 August.
If you found this post helpfull so please Like and encourage..
Follow to get more updates.
HCLTECH - FOLLOWER REQUESTLEVELS FOR REFERENCE
NSE:HCLTECH
******************************************************************************************************************************************************************
Hi all,
Its pleasure to have you all here.
I have started putting these charts as a contribution from my side to all people who are new to business, as I had to struggle a lot without any sources at disposal. So please consider this a just small contribution from my side.
Few Honest Disclosures:
1. Any idea shared is my personal view, its not a recommendation, neither any kind of paid propaganda, so please
do your bit of research.
2. Ideas shared does not mean that I trade all or have position in them, this is just a helping hand to all.
3. I expect no comments or like nor any negativity, as I said its just a small helping hand from my side, please plan your risk and trade as per your capacity.
4. To trade in Cash, options or futures is your sole choice and your own risk
5. I am no expert in Tech Indicators, I believe in support resistance and trendline theory, you may use this as a supplement theory for better results.
6. I work for my own living, this is a hobby which I do sincerely to help anyone who might come across my charts.
***********************************************************************************************************************************************
HCL tech at 31 July 2020HCL has given a great breakout as expected with good earning report it sky rocketed ...
For some time the stock is in consolidation mode ===> also overbought mfi multiple times
Major Resistance 720
Major Support 690
these two are to be watch and closing in atleast hourly or 4h important ...
not expecting Resistance to break ---> personally expecting a breakdown ( retracement ) till 660 zone
Option Strategy -> no such good strategy comes in mind ...

Hcl Technologies Ltd (Hcltech - NSE) - stay long Hcl Technologies Ltd (Hcltech - NSE) has extended 5th wave, so stay long if price gaps down near 692 as 4th subwave of 3rd of 5th wave, for new high as target around 725-35 zone. It sector itself is a stronger in last move and continue its gain.

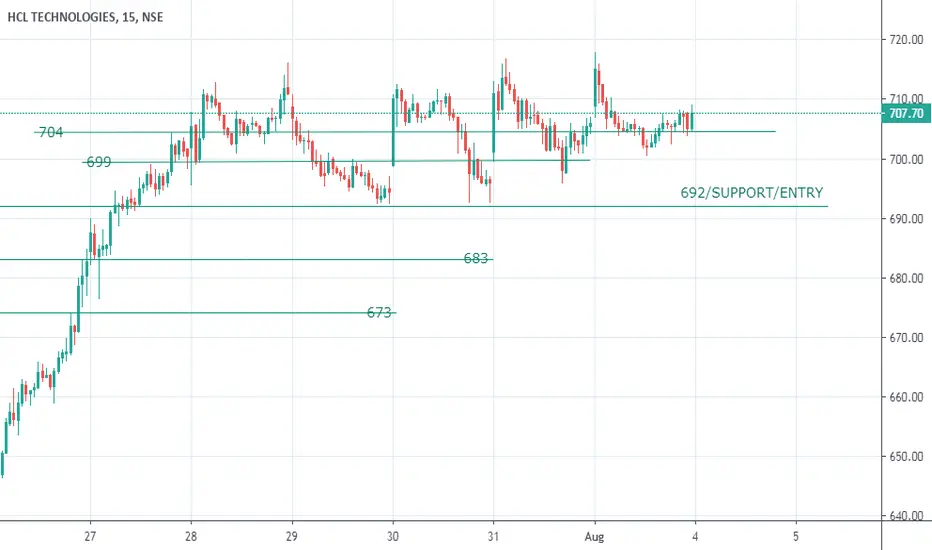
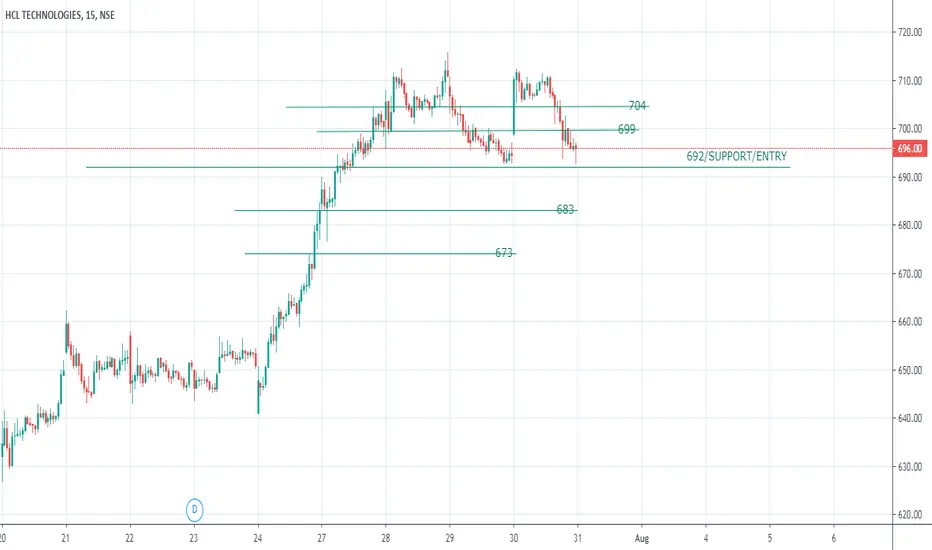
HCLTECHNSE:HCLTECH
With markets poised to fall tomorrow, IT seems a good bet, so if someone is long in this, remember the support of 692.
If it goes below that and sustains, u can see levels of 683 and 673, on upside 699, 704 and above
***CAREFUL*** - its a small timeframe chart, be cautious
*********************************************************************************************************************************************
Hi all,
Its pleasure to have you all here.
I have started putting these charts as a contribution from my side to all people who are new to business, as I had to struggle a lot without any sources at disposal. So please consider this a just small contribution from my side.
Few Honest Disclosures:
1. Any idea shared is my personal view, its not a recommendation, neither any kind of paid propaganda, so please
do your bit of research.
2. Ideas shared does not mean that I trade all or have position in them, this is just a helping hand to all.
3. I expect no comments or like nor any negativity, as I said its just a small helping hand from my side, please plan your risk and trade as per your capacity.
4. To trade in Cash, options or futures is your sole choice and your own risk
5. I am no expert in Tech Indicators, I believe in support resistance and trendline theory, you may use this as a supplement theory for better results.
6. I work for my own living, this is a hobby which I do sincerely to help anyone who might come across my charts.
***********************************************************************************************************************************************
HCL IS AT A VERY IMPORTANT LEVEL!!HCL IS AT A VERY IMPORTANT LEVEL OF 695. LET IT BREAK AND SUSTAIN TARGETS CAN BE 705--711
LEVELS & TARGETS AS PER CHART
HAHAHA LET'S GO JAI HIND!!

