HCL Tech for LongWhat a beautiful pattern, stock is gradually moving upward with a consistent positive sign.
Many positive developments underway
www.financialexpress.com
www.moneycontrol.com
Entry at current level looks good, holding period of 1-2 year will benefit the investors.
Note: Please consult your financial advisor before making any investments. This idea is only for educational purposes.
HCLTECH trade ideas
$HCLTECH 10R short ideaThis is a dicy area, but if the SL is followed and if the stock moves in our way this could give a 10R opportunity.
This is for educational purposes only . Please consult your financial advisor or do your own analysis before any trades.

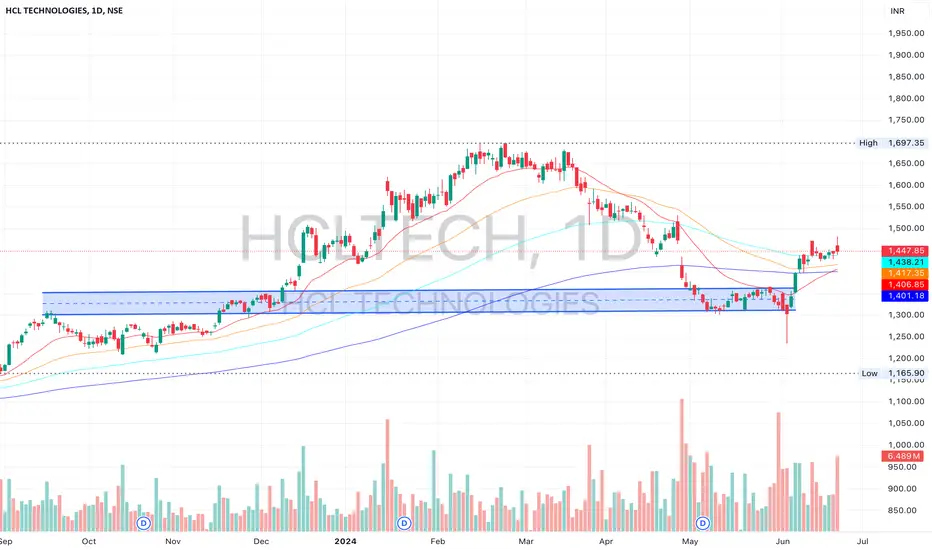
HCLTECH LongHCLTECH is at demand zone, can be accumulated between 1300 to 1330 for short term target of 1440

HCLTECH 1DAYNICE BREAKOUT IS OBSERVED
WAIT FOR THE RETEST
I Am Not SEBI Registered Analyst. All Post and Levels Posting is only for educational and knowledge purpose. I Am not responsible for your any kind of loss or profit.
No Claim, All Rights Reserved.‼️

HCL TechHCL tech for long term, looking good at current level with strong financial performnace and high quality, the stock is consolidating from a long time.
HCLTECHNSE:HCLTECH
Good Stock of IT Sector
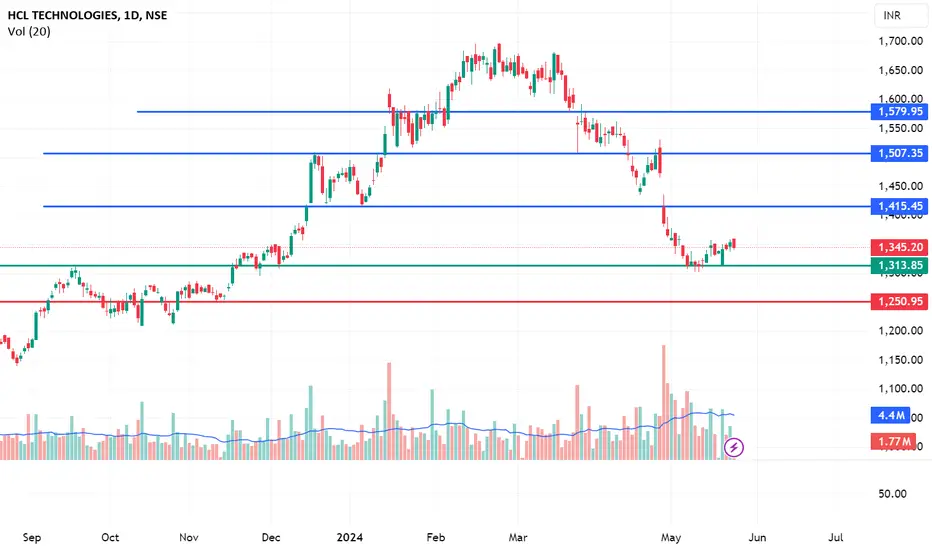
HCL Technologies (HCLT) reported weak Q4 performance with 0.3% QoQ CC consolidated revenue growth.
Support- 1313-1300
sl- 1250
Target- 1365/1415/1507/1579
Rsi >40 oversold zone
Good for Accumalate and will give good return in Mid term
HCL TECH Buy ( Demand zone confluence with Fibbonacci)HCLTECH is approaching demand zone which has a confluence with 50% of Fibonacci. Time to go long.

Time to cover short in HCL Tech?
After fall of around 20% , downswing in HCLTech seems to be over. I think it is time to cover short and initiate fresh long position.

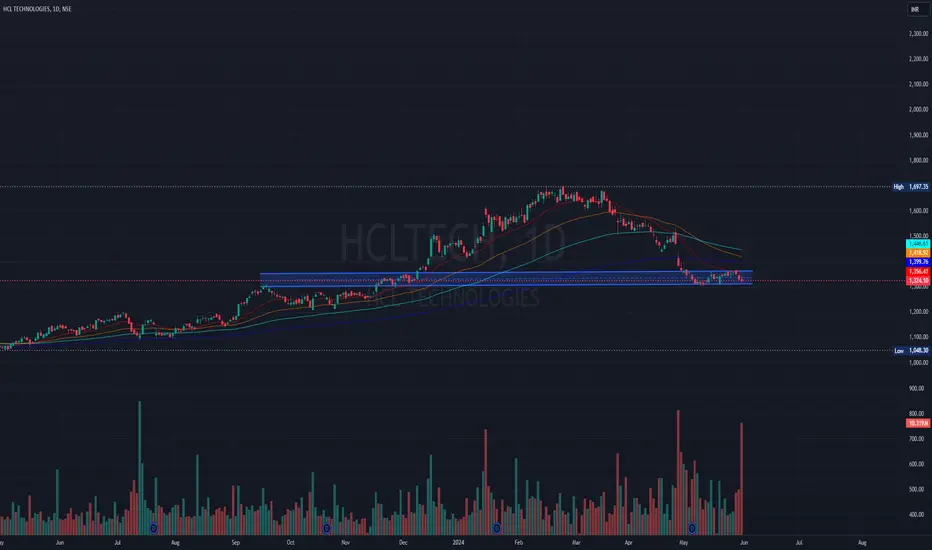
Hcl tech : breakout of Rounding bottom and Retesting the baselinTech company showing some investors interest after smart fall.
Hcl would be good and safe investment out of them.
It is showing a formation of Rounding bottom and now Retesting the base line after breakout and rally of 20%.
Now do start investing and accumulation at this level for the target of 1700/1800/1900.
Healthy averaging would be considered at 1200-1250.
Time frame:6-9 months

HCL STOCK BUYING TIMEthis is my personal view hcl tech stock previously formed rounding pattern and breakout . Now it has retest clearly.

Elliott Wave Analysis of HCLTECH: Wave 5 in FocusElliott Wave Analysis of HCLTECH
In this analysis, we will examine the Elliott Wave count of HCL Technologies Limited (HCLTECH) and provide insights into the current wave structure on various time frames. This is purely for educational purposes and should not be taken as investment advice.
Monthly Time Frame:
Bigger Wave I and II: HCLTECH has completed its Bigger wave I and II on the monthly time frame.
Wave III: The stock is currently unfolding wave III on the monthly time frame.
Weekly Time Frame:
Within wave III, we observe weekly counts unfolding as subdivisions in wave ((1)) & ((2)). The stock is currently in wave ((3)).
Inside wave (3), subdivisions as wave 1-2-3 & 4 have been completed.
Daily Time Frame:
We are now possibly unfolding wave 5, which is a subdivision of wave ((3)).
Wave 4: The daily wave 4 has completed its subdivisions as wave ((w)), ((x)), ((y)), ((x)), and ((z)).
Wave ((i)) of 5: If our assumptions are correct, we have started to unfold wave ((i)) of wave 5.
Key Levels and Risk Management:
Invalidation Level : The low of wave 4 is set at 1435, serving as the invalidation level for going long. This is the stop loss level to be mindful of when entering a trade.
Upside Target : Wave 5 could cross above the highs of wave 3, which is the all-time high at 1697, and more.
Insights:
Confirmation of Trend: Watch for a clear breakout and confirmation of trend to validate the start of wave ((i)) of 5.
Caution: As with any investment, caution should be exercised, and risk management is essential.
Market Behavior: Keep an eye on market behavior and patterns as they unfold to validate the count.
This analysis is intended for educational purposes only and should not be considered a trade or investment tip. Always conduct your own analysis and consult with a professional before making any investment decisions.
I am not Sebi registered analyst.
My studies are for educational purpose only.
Please Consult your financial advisor before trading or investing.
I am not responsible for any kinds of your profits and your losses.
Most investors treat trading as a hobby because they have a full-time job doing something else.
However, If you treat trading like a business, it will pay you like a business.
If you treat like a hobby, hobbies don't pay, they cost you...!
Hope this post is helpful to community
Thanks
RK💕
Disclaimer and Risk Warning.
The analysis and discussion provided on in.tradingview.com is intended for educational purposes only and should not be relied upon for trading decisions. RK_Charts is not an investment adviser and the information provided here should not be taken as professional investment advice. Before buying or selling any investments, securities, or precious metals, it is recommended that you conduct your own due diligence. RK_Charts does not share in your profits and will not take responsibility for any losses you may incur. So Please Consult your financial advisor before trading or investing.

HCL TECHNOLOGIES S/R Support and Resistance Levels: In technical analysis, support and resistance levels are significant price levels where buying or selling interest tends to be strong. They are identified based on previous price levels where the price has shown a tendency to reverse or find support.
Support levels are represented by the green line and green shade, indicating areas where buying interest may emerge to prevent further price decline.
Resistance levels are represented by the red line and red shade, indicating areas where selling pressure may arise to prevent further price increases. Traders often consider these levels as potential buying or selling opportunities.
Breakouts: Breakouts occur when the price convincingly moves above a resistance level (red shade) or below a support level (green shade). A bullish breakout above resistance suggests the potential for further price increases, while a bearish breakout below support suggests the potential for further price declines. Traders pay attention to these breakout signals as they may indicate the start of a new trend or significant price movement.
Disclosure: I am not SEBI registered. The information provided here is for learning purposes only and should not be interpreted as financial advice. It is important to consult with a qualified financial advisor before making any investment decisions. Tweets neither advice nor endorsement.
HCL near its short term bottom?
It seems HCL is near its short term bottom. It has already gone down by around 15% from its last high. I see maximum 3-4% downside after which it should start its upswing again. Should we buy tomorrow or wait for couple of days more and take long position on Monday? Please share your views.

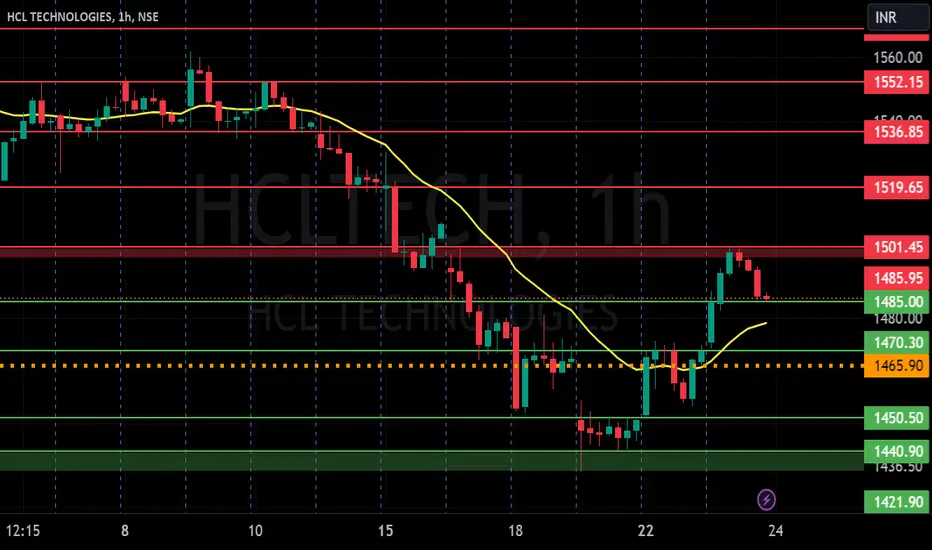
Symmetrical Triangle pattern breakout in HCLHCL TECHNOLOGIES LTD
Key highlights: 💡⚡
✅On 1 Hour Time Frame Stock Showing Breakout of Symmetrical Triangle Pattern.
✅Strong Bullish Candlestick Form on this timeframe.
✅It can give movement up to the Breakout target of 1610+.
✅Can Go Long in this Stock by placing a stop loss below 1530-.

HCL Cup and Handle Breakdown !!!Hello All,
The recommendations are purely for educational purpose only, consult you financial advisor before trading.
Targets are mentioned in charts (either red lines or balck lines), keep Stop Loss as per your risk..
If you like my Idea, Don't forget to Boost and comment on my Analysis..
Have a profitable year ahead
Gautam Khanna
Technical Analyst by Passion :-)

HCLTECH--Rally base rally or Manipulation
This stock is now in consolidation
we have a strong support lies lies at 1580 range...
we have a rally base rally chance in this stock.
if price manipulation happens...to downside price distribution will observe to topside as well.
indicating bullishness in this stock price.
keep in long side from support levels.
case1::
case 2::
case 3::

HCL TECHFOLLOWING THIS TRENDLINE IN DAILY AND 4HR CHART you can target for intraday trade and swing bet also. As IT is in flaour

Time to long HCL tech maybeTime for this stock to move a bit high now. Once the resistance is broken I will double my investment around 1130 ish. Wish me luck :)

Uptrend Channel pattern breakout in HCLTECHHCL TECHNOLOGIES LTD
Key highlights: 💡⚡
✅On 1Hour Time Frame Stock Showing Breakout of Uptrend Channel Pattern.
✅Strong Bullish Candlestick Form on this timeframe.
✅It can give movement up to the Breakout target of 1660+.
✅Can Go Long in this stock by placing a stop loss below 1595-.

HCLTech Result view cmp 1224HCLTech Result view cmp 1224
trading at daily support
upper side 1275 - 1285
High possibilities to break 52week high positionally

New Journey for HCLTECH ?Stock gave perfect retest after breakout on a WEEKLY chart : Also stock has posted massive results which will result in upmove .
Entry - cmp or 1469
SL - your risk ( max - 5% )
Target - 1628, 1783
-- DISCLAIMER --
I am not a financial advisor or SEBI registered.
This is just a view.
Please DO YOUR OWN RESEARCH before investing in any stock.
Happy trading.
Peace.

Hcl tech very strong for upcoing daysHcl tech 2nd time recomdation for long side possible target will come for 1450-1500 invalid below 1248

HCLTECH BREAKOUT We have a breakout in HCLTECH, Volume looks too good here with 1510 as a stop loss on daily one can go long with targets of 1550/1580/1600.
