HCL TECH ( READY TO FIRE)All time high break out and ready to fire to stock. Followed by awsome volume. and key moving averages.
sl 1308
HCLTECH trade ideas

HCLTECH NSE:HCLTECH
One Can Enter Now !
Or Wait for Retest of the Trendline (BO) !
Or wait For better R:R ratio !
Note :
1.One Can Go long with a Strict SL below the Trendline or Swing Low.
2. R:R ratio should be 1 :2 minimum
3. Plan as per your RISK appetite and Money Management.
Disclaimer : You are responsible for your Profits and loss, Shared for Educational purpose

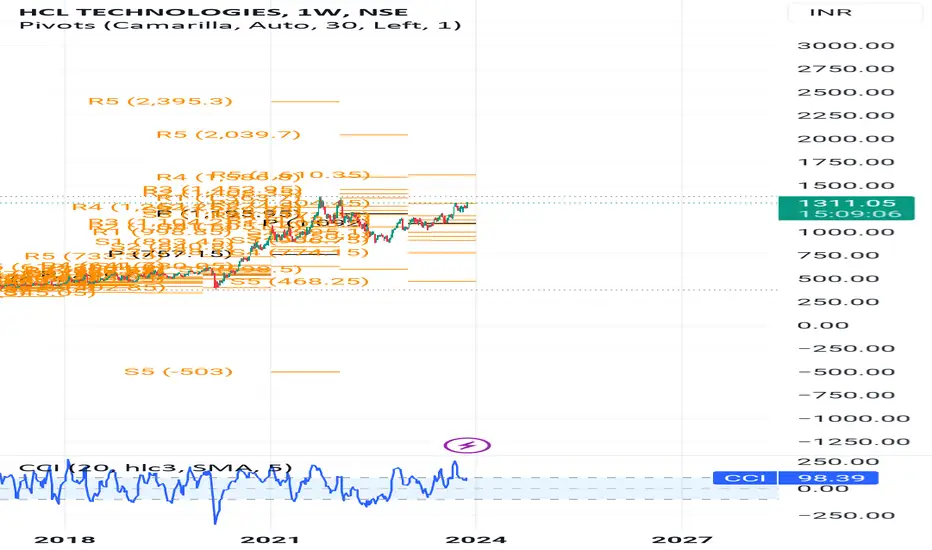
GUD RANGE BREAK OUT ON MONTHLY TIME FRAMERange break out in HCL tech . in monthly as well as weekly time frame . if this month close in positive. it is range break out of 8 months. it may have gud upside target. first target will be at all time high.
SL for swing 1090.
only one problem is this that it sector not supporting its moments.

Double TOP ?Clearly We can see Double Bottom With RSI Divergence and follow up of price Action
Same Thing in Double Top But waiting For some Clarifications.
Gratify if you appreciate the practice then you can like it, share it and
If you want me to investigate any chart for you then would cherish doing that for you.
Thank you for your time and support.
Stay safe.

POSITIONAL TRADE(HCLTECH)POSITIONAL TRADE(HCLTECH)
Looks Good ABOVE 1375
SL 1206
Target 1417-1457-1500-1751-2168
Hold few Months
Please consult your financial advisor before investing
All research is for educational purposes only.

HCL Tech Long Call
HCL Technology has broke its major resistance level early after 2 years, with strong volume and price towards higher side, its a good buy with limited risk and high RR ratio.
Let this stock cool down for a wile and it can be bought for a positional trade or long term trades.

HCL TECH#HCL TECH (W)
- Strong Breakout
- Trading All Time high
- Strong Bullish Momentum
- Massive Volume Buildup
- 🎯 1580....1640....1720
- # Educational Purpose
#Investing

HCL Tech Long Weekly HCL Tech after a long buildup has given a volume breakout. It form a long basing pattern and took more than a year to break the resistance level.
Breakout will be invalid below the price 1352

hcltech long buy @ cmp target 1229, 1249, 1299,1349 risk rewardhcltech long buy @ cmp target 1229, 1249, 1299,1349
risk reward 2.8
sl@1109

WAIT FOR BREAKOUTHcltech is trading near All time high. Wait for breakout and retest the levels.
Plan your trade with good RR.

💥HCL Tech💥-Nice Breakout💥HCL Tech💥-Nice Breakout
Capital to be deployed- 20k
Investing Price-1304-1311
Breakout Price-1304
Stoploss-1171
Targets-1610-2039
RT for max reach
#hcltech #StocksToBuy #stocks #StocksToTrade #StocksInFocus #stockstowatch #StocksInNews
Looks like this can be sold for quick winLooks like this can be sold for quick win
SL ans hedge must

HCLTECH--Bearish Gap @1300This stock is ready to test the Bearish gap at 1300 and have a strong resistance at 1310 levels...
Keep in long from 1240 levels...No short side this gap will finish soon.


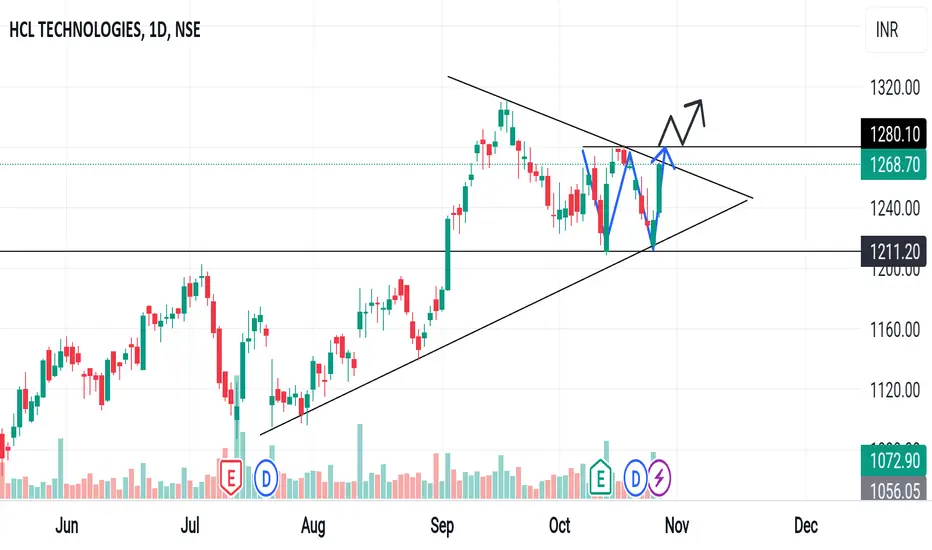
HCLTECH📢 W pattern 📢
CMP: 1268.70
If stock price 1280.10 day candle closing top than bullish movement see in coming days!
These are swing ideas which you can add your watchlist and analysis for yourself !
Keep on your radar 📡
This content only education purpose!
❗I am not sebi ragister❗
HCLTECH: Trading near all time highIt has formed double bottom pattern and good bullish with volume.
We can expect 8-9% up move from here.

BULLISH ENGULFING IN HCLTECHBullish engulfing with volumes in DailyTF
Formed at Breakout Retest Zone.
Trade Execution and Target on Chart
Idea Invalid below 1230

HCL TECHNOLOGIESCompany is almost debt free.
Stock is providing a good dividend yield of 3.75%.
Company has been maintaining a healthy dividend payout of 65.5%
HCL TECH HAS FORMED CUP WITH HANDLE PATTERN
RED ARROW MARKED SHOWS RECENT BREAK OUT CANDLE
ITS CONSISTENTLY IN THE Y/Y PROFIT
CURRENT PRICE-1275
TARGET PRICE-1521

HCLTECH--Channel Breakdown??After a strong breakout from trendline price tested trendline and resistance ,
again turned to be bearish by breaking the channel again...
if retest tomorrow price retest to the channel , will looking for short side...

Hcl technology 30% gain HCL technology 30% gain
cup and handle pattern
Great company
Wasting period is 1 year

HCT TECHHCL Tech is a forgotten icon of the IT industry, and as a result, it offers us the chance to make some long-term investments.
It has now corrected by almost 200 rupees from its previous high.
This is purely for educational purposes.
not recommended; before making an investment, speak with your advisor.

HCLTECH triangle pattern HCL Technologies stock is forming a triangle pattern on weekly charts. This pattern indicates that the stock is consolidating and could be ready for a breakout. If the stock breaks above the 1200 level on the weekly chart, it could see further upside movement.

#HCLTECH: Higher odds of moving towards ATHHCLTECH took good support at it´s previous highs ~900, and in fact made a double bottom over there. The Jan - April downward movement of the overall market also had little pressure towards the downside.
Trading near the confluence of 2 trendlines, and taking support consistently above the upward trendline, the odds of hitting the previous ATH ~1360 and making fresh ATH is higher.
