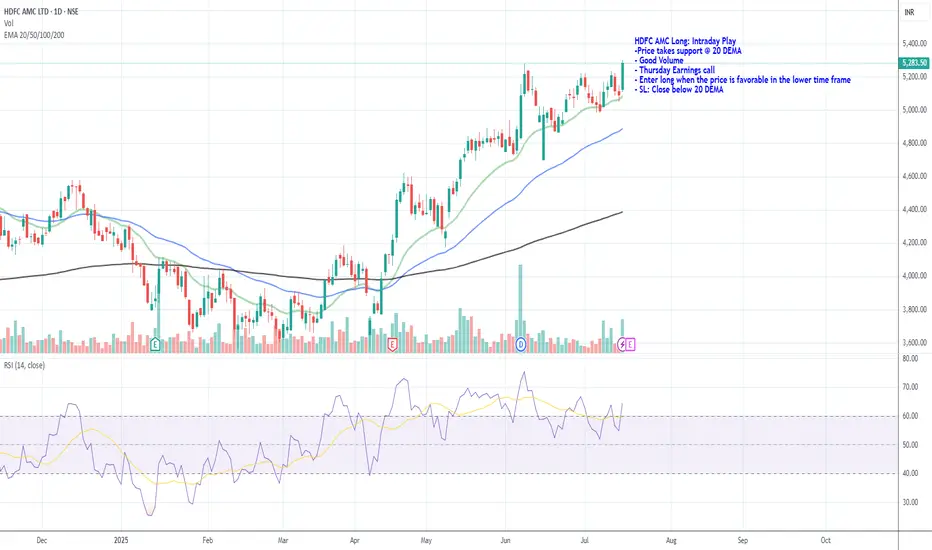
HDFC AMC Long: Intraday PlayHDFC AMC Long: Intraday Play
-Price takes support @ 20 DEMA
- Good Volume
- Thursday Earnings call
- Enter long when the price is favorable in the lower time frame
- SL: Close below 20 DEMA
HDFCAMC trade ideas
HDFCAMC in Pennant Trend PatternNSE:HDFCAMC shows a breakout of a Pennant Trend Pattern. Please Buy once there is a Bullish breakout. Target would be 5750
HDFC AMC Long_ Support @ 20 DEMAHDFC AMC Long:
-Price takes support @ 20 DEMA
- Good Volume
- Enter long when the price is favorable in the lower time frame
- SL: Close below 20 DEMA

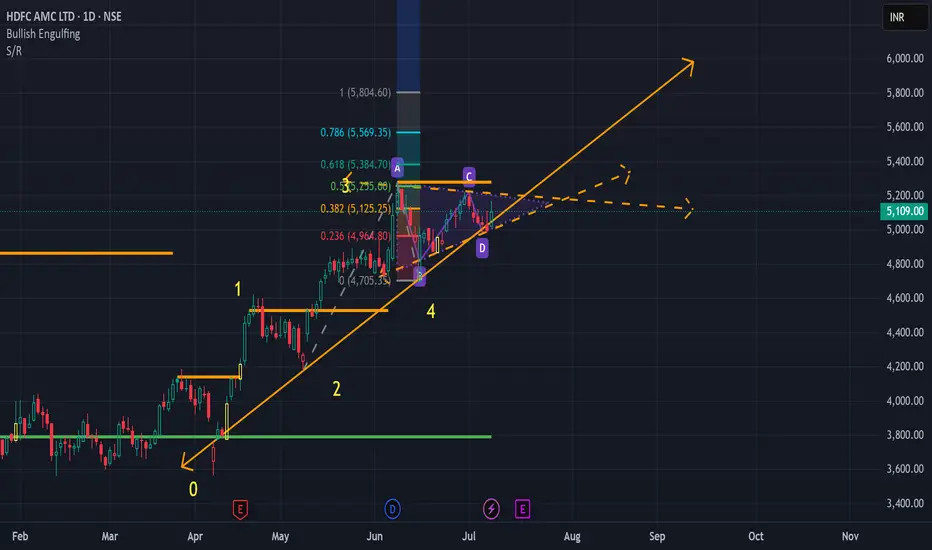
HDFC Asset Management Buy27-Jun-2025 (Friday)
HDFC Asset Management bounced back from trend line. Also it tested previous ATH as support and reversed upwards. Buy @CMP (5150) with SL of 4860 and target of 5250, 5550-5600 & 6900

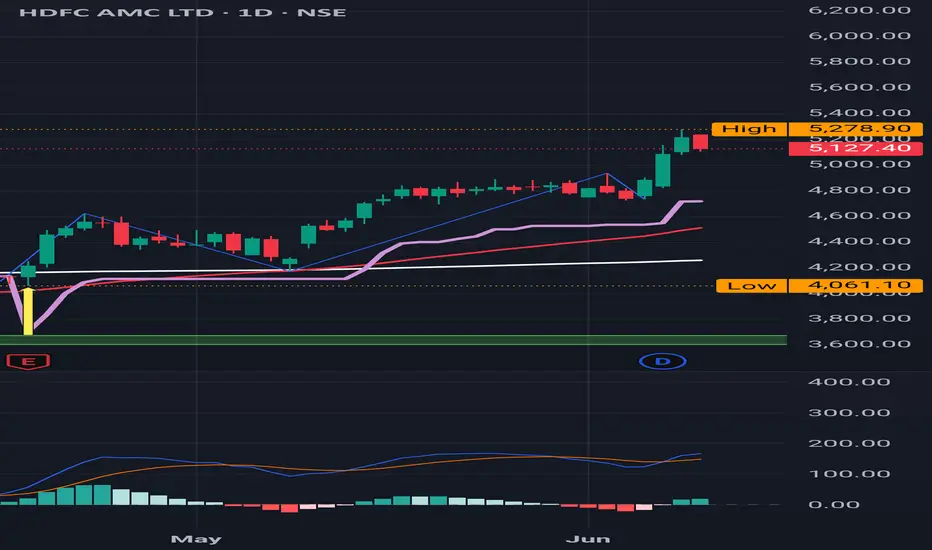
HDFC AMC : A fantastic run after a Buy signal
HDFC AMC : A fantastic run after a Buy signal.
Today it's showing a some sign of consolidation or profit booking .
It announced a hefty dividend on Friday June 6th of Rs 90.
( Not a Buy / Sell Recommendation
Do your own due diligence ,Market is subject to risks, This is my own view and for learning only .)
HDFC AMC – Bullish Flag Formation on Daily ChartHDFC AMC is currently exhibiting a bullish flag formation, a classic continuation pattern following a strong vertical rally. The recent price action is consolidating within a downward-sloping channel, typically seen as a pause before the next leg up.
Key Technical Levels:
Flag upper boundary (first resistance): Around ₹4,400
Flag high / prior resistance: ₹4,583.65
All-time high: ₹4,867.00
A breakout above the flag’s upper line could signal fresh buying momentum with the potential to first retest the flag high and possibly challenge the all-time high if the breakout sustains.
Fundamentals Snapshot:
Dividend Yield: 1.64%
ROCE: 43.3%
ROE: 32.4%
PE Ratio: 37.09 (vs Industry PE of 20.70)
Growth Metrics:
Compounded Sales Growth:
10 Years: 13%
Compounded Profit Growth:
10 Years: 19%
Stock Price CAGR:
5 Years: 10%
This combination of strong technical setup and solid financial performance suggests HDFC AMC remains a strong contender in the asset management space.
Recent escalations along the India-Pakistan border have led to military confrontations, increasing uncertainty in the broader market. If tensions worsen, volatility may rise, and market sentiment could turn risk-off, impacting financial market. Traders should stay alert for any escalation news.
Disclaimer:
This post is for educational purposes only and is not financial advice. Please do your own research or consult a financial advisor before making any investment decisions. Market conditions and geopolitical developments can change rapidly.

Low Volume Node may act as resistancethe Volume Profile is a charting technique (indicator) that shows the trading activity of a specific financial asset over time. This indicator uses horizontal bars to reflect trading activity at different price points. The bars are stacked vertically, with the highest indicating the areas with the most trade activity.
The Volume Profile is a relatively new charting technique created in the late 1980s by a trader called Peter Steidlmayer. He was a talented futures trader at the Chicago Board of Trade (CBOT) seeking a more efficient approach to examining market data.
Steidlmayer noticed that typical technical indicators, including oscillators, moving averages, and trendlines, did not accurately portray market trends and reversals. He believed the amount of trading activity at every price point was a more reliable measurement of market sentiment, so he began developing a statistical model to analyze this data.
The first thing that drew Steidlmayer’s attention was the fact that price swings were not random but instead preferred to cluster around particular price levels. He also noted that the trading activity was higher at certain levels than at previous levels.
Based on these discoveries, Steidlmayer developed a new method of assessing markets that considered both price and volume. He called this approach Market Profile, which later evolved into the Volume Profile indicator.

Review and plan for 17th January 2025 Nifty future and banknifty future analysis and intraday plan.
Quarterly results.
This video is for information/education purpose only. you are 100% responsible for any actions you take by reading/viewing this post.
please consult your financial advisor before taking any action.
----Vinaykumar hiremath, CMT

HDFCAMC -INTRADAYHDFCAMC -INTRADAY
As per the candle Physiology next candle or after 2-3 candle it will go down to fill the gap

HDFCAMC Bullish and trending in 15 min, go long after price 4747HDFCAMC did breakout last week and trading in bullish area,
It is also looking trending in 15 Min. timeframe and trading at good level for intraday.
We can go long after price of 4747.
Note : Its just an analysis, wait for the price to confirm.
Disclaimer : Always follow risk to reward, this is the only key to success in market, no matter how much good a trade is looking we never know the future.

HDFC AMC LTD S/R Support and Resistance Levels:
Support Levels: These are price points (green line/shade) where a downward trend may be halted due to a concentration of buying interest. Imagine them as a safety net where buyers step in, preventing further decline.
Resistance Levels: Conversely, resistance levels (red line/shade) are where upward trends might stall due to increased selling interest. They act like a ceiling where sellers come in to push prices down.
Breakouts:
Bullish Breakout: When the price moves above resistance, it often indicates strong buying interest and the potential for a continued uptrend. Traders may view this as a signal to buy or hold.
Bearish Breakout: When the price falls below support, it can signal strong selling interest and the potential for a continued downtrend. Traders might see this as a cue to sell or avoid buying.
20 EMA (Exponential Moving Average):
Above 20 EMA(50 EMA): If the stock price is above the 20 EMA, it suggests a potential uptrend or bullish momentum.
Below 20 EMA: If the stock price is below the 20 EMA, it indicates a potential downtrend or bearish momentum.
Trendline: A trendline is a straight line drawn on a chart to represent the general direction of a data point set.
Uptrend Line: Drawn by connecting the lows in an upward trend. Indicates that the price is moving higher over time. Acts as a support level, where prices tend to bounce upward.
Downtrend Line: Drawn by connecting the highs in a downward trend. Indicates that the price is moving lower over time. It acts as a resistance level, where prices tend to drop.
RSI: RSI readings greater than the 70 level are overbought territory, and RSI readings lower than the 30 level are considered oversold territory.
Combining RSI with Support and Resistance:
Support Level: This is a price level where a stock tends to find buying interest, preventing it from falling further. If RSI is showing an oversold condition (below 30) and the price is near or at a strong support level, it could be a good buy signal.
Resistance Level: This is a price level where a stock tends to find selling interest, preventing it from rising further. If RSI is showing an overbought condition (above 70) and the price is near or at a strong resistance level, it could be a signal to sell or short the asset.
Disclaimer:
I am not a SEBI registered. The information provided here is for learning purposes only and should not be interpreted as financial advice. Consider the broader market context and consult with a qualified financial advisor before making investment decisions.

HDFCAMC Swing Trade SetupEnter only when 15minute candle closes above the Entry Zone Price - 4388.95
Target with Risk to reward 1:2 is 4966.85
Stoploss only when 1 day candle closes below the price - 4100
Note: This is not any financial advice, this is for education purpose only.

HDFCAMC Near Breakout ZonesHDFCAMC near to resistance zones and these zones already tested multiple times and can be a weak zone, there is a highly chance that it can breakout.
Note : This is just an analysis wait for the price to confirm.
Disclaimer :
Always follow Risk to Reward, because this is the key to success in this business, no matter how much good a trade is looking, we never know the future.

HDFCAMC Bullish Flag buybullish flag formed in HDFCAMC stock. chances are 50-50% in this scenario this time.

Plan for 21st August 2024Nifty future and banknifty future analysis and intraday plan in kannada.
Swing ideas included.
This video is for information/education purpose only. you are 100% responsible for any actions you take by reading/viewing this post.
please consult your financial advisor before taking any action.
----Vinaykumar hiremath, CMT

Consolidating Time Over...NSE:HDFCAMC trade at 4300, and consolidating between 3600-4200 from last 6 month. Now consolidating time is over, when its range break then its next Resistence is at 4800...

Review and plan for 18th July 2024Nifty future and banknifty future analysis and intraday plan in kannada.
Stocks to watch included.
This video is for information/education purpose only. you are 100% responsible for any actions you take by reading/viewing this post.
please consult your financial advisor before taking any action.
----Vinaykumar hiremath, CMT


Review and plan for 27th June 2024Nifty future and banknifty future analysis and intraday plan in kannada.
This video is for information/education purpose only. you are 100% responsible for any actions you take by reading/viewing this post.
please consult your financial advisor before taking any action.
----Vinaykumar hiremath, CMT

Review and plan for 26th June 2024 Nifty future and banknifty future analysis and intraday plan in kannada.
This video is for information/education purpose only. you are 100% responsible for any actions you take by reading/viewing this post.
please consult your financial advisor before taking any action.
----Vinaykumar hiremath, CMT

A Clear Breakout on HDFC AMC ChartHere you can witness a clear breakout of the Trendline in Blue Color and Resistance Level in Red Color, Which means this share is ready to enter in up-trend now. One can consider this share for a good return in the Long Term period. But for a short period, my defined targets are as below:
Entry above - Rs 2000
1st Target - Rs 2200
2nd Target - Rs 2300
Long-Term Target - Rs 3000
Stoploss (Which needs to maintained) - Rs 1961
Note: Please discuss with your advisor before taking any trade as per my analysis.

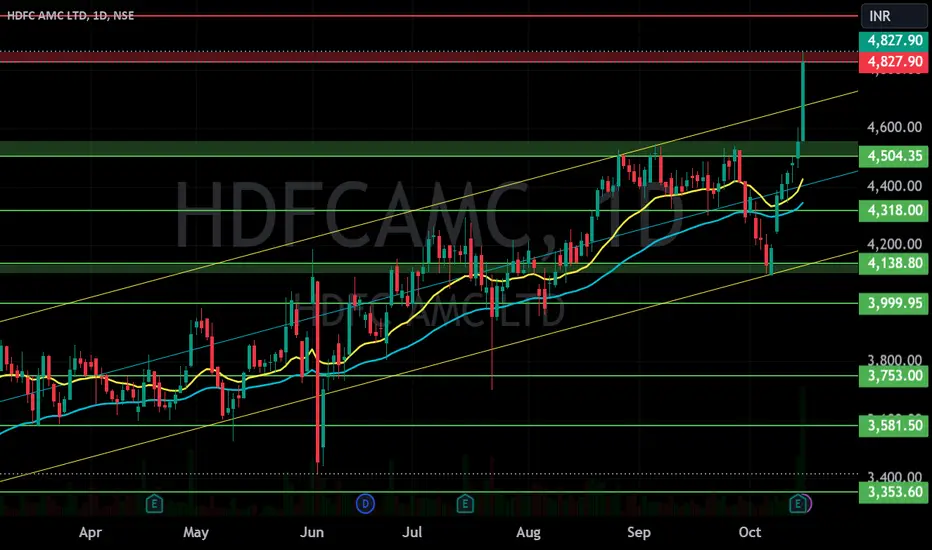
HDFC AMCHdfc AMC created a new higher high after retesting the break of 3446 level. Stock is ready to move to 5200 and 6100 level. SL 3400.
