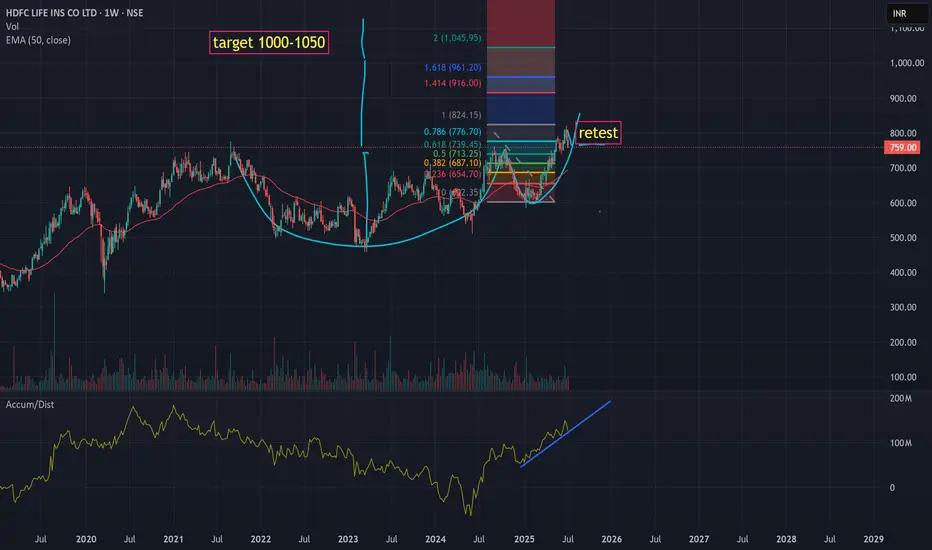
should move to 1000 Range after current retest of breakout Should try to breakout from the support retest as there is no negative news and result is due this week. Should run to 820-850 this week before results if not manipulated.
Next report date
—
Report period
—
EPS estimate
—
Revenue estimate
—
8.75 INR
18.11 B INR
1.01 T INR
946.37 M
About HDFC LIFE INS CO LTD
Sector
Industry
CEO
Vibha U. Padalkar
Website
Headquarters
Mumbai
Founded
2000
ISIN
INE795G01014
FIGI
BBG00CRG21Q5
HDFC Life Insurance Co. Ltd. engages in the provision of life insurance services. It operates through the India and Middle East geographical segments. The company was founded on August 14, 2000 and is headquartered in Mumbai, India.
Related stocks
Long HDFC life:
-Price takes support at 20 Daily EMA
-Bullish Engulfing Candle
- Enter long when the price is favorable in lower time frame
- SL: Close below 20 Daily EMA

HDFC life Long _ Support @ 20 Daily EMAHDFC life:
-Price takes support at 20 Daily EMA
-Bullish Engulfing Candle
- Enter long when the price is favorable in lower time frame
- SL: Close below 20 Daily EMA

Buy Hdfclife insurance perfect Target 876Everything mention about in my chart
Technically very strong confirmation
Technical 3 indicator
1st indicator channel flying price 769
2nd indicator filag price 788
3rd Elliott wave target 876
small stoploss 801 day closing
conclusion ; I am not sebi reg Not recommendation to buy this i

HDFC Life Insurance Buy27-Jun-2025 (Friday)
HDFC Life Insurance reversed taking support from channel line as well as it previous ATH. Seems to make false breakdown and reversed upside to new ATH. Buy @CMP (807) with SL of 770 and target of 840-860

Hdfc life gives breakout of 4 year consolidation zoneHdfc life gave weekly breakout of 4 year consolidation zone.

Cup and handle pattern Retesting the cup and handle pattern.
Good to go long in it.
Educational purposes only.

Clear bullish indication Newly breakout and was telling us to going up.
Just for educational purposes


HDFC Life Insurance – Bullish Breakout on Monthly ChartHDFCLIFE is forming a strong ascending triangle on the monthly chart, signaling long-term bullish potential. A breakout above ₹750 with volume can trigger a fresh rally toward ₹880–₹920 in the coming months. RSI is trending up with strong momentum, which confirms buying interest. In the short term,

See all ideas
Summarizing what the indicators are suggesting.
Neutral
SellBuy
Strong sellStrong buy
Strong sellSellNeutralBuyStrong buy
Neutral
SellBuy
Strong sellStrong buy
Strong sellSellNeutralBuyStrong buy
Neutral
SellBuy
Strong sellStrong buy
Strong sellSellNeutralBuyStrong buy
An aggregate view of professional's ratings.
Neutral
SellBuy
Strong sellStrong buy
Strong sellSellNeutralBuyStrong buy
Neutral
SellBuy
Strong sellStrong buy
Strong sellSellNeutralBuyStrong buy
Neutral
SellBuy
Strong sellStrong buy
Strong sellSellNeutralBuyStrong buy
Displays a symbol's price movements over previous years to identify recurring trends.
Frequently Asked Questions
The current price of HDFCLIFE is 762.35 INR — it has increased by 0.67% in the past 24 hours. Watch HDFC LIFE INS CO LTD stock price performance more closely on the chart.
Depending on the exchange, the stock ticker may vary. For instance, on NSE exchange HDFC LIFE INS CO LTD stocks are traded under the ticker HDFCLIFE.
HDFCLIFE stock has risen by 0.97% compared to the previous week, the month change is a −2.27% fall, over the last year HDFC LIFE INS CO LTD has showed a 14.47% increase.
We've gathered analysts' opinions on HDFC LIFE INS CO LTD future price: according to them, HDFCLIFE price has a max estimate of 975.00 INR and a min estimate of 720.00 INR. Watch HDFCLIFE chart and read a more detailed HDFC LIFE INS CO LTD stock forecast: see what analysts think of HDFC LIFE INS CO LTD and suggest that you do with its stocks.
HDFCLIFE reached its all-time high on Jun 30, 2025 with the price of 820.75 INR, and its all-time low was 307.00 INR and was reached on Nov 17, 2017. View more price dynamics on HDFCLIFE chart.
See other stocks reaching their highest and lowest prices.
See other stocks reaching their highest and lowest prices.
HDFCLIFE stock is 2.05% volatile and has beta coefficient of 0.79. Track HDFC LIFE INS CO LTD stock price on the chart and check out the list of the most volatile stocks — is HDFC LIFE INS CO LTD there?
Today HDFC LIFE INS CO LTD has the market capitalization of 1.64 T, it has decreased by −1.97% over the last week.
Yes, you can track HDFC LIFE INS CO LTD financials in yearly and quarterly reports right on TradingView.
HDFC LIFE INS CO LTD is going to release the next earnings report on Oct 17, 2025. Keep track of upcoming events with our Earnings Calendar.
HDFCLIFE earnings for the last quarter are 2.54 INR per share, whereas the estimation was 2.90 INR resulting in a −12.56% surprise. The estimated earnings for the next quarter are 2.63 INR per share. See more details about HDFC LIFE INS CO LTD earnings.
HDFC LIFE INS CO LTD revenue for the last quarter amounts to 148.75 B INR, despite the estimated figure of 151.07 B INR. In the next quarter, revenue is expected to reach 189.09 B INR.
HDFCLIFE net income for the last quarter is 5.48 B INR, while the quarter before that showed 4.75 B INR of net income which accounts for 15.35% change. Track more HDFC LIFE INS CO LTD financial stats to get the full picture.
Yes, HDFCLIFE dividends are paid annually. The last dividend per share was 2.10 INR. As of today, Dividend Yield (TTM)% is 0.28%. Tracking HDFC LIFE INS CO LTD dividends might help you take more informed decisions.
HDFC LIFE INS CO LTD dividend yield was 0.31% in 2024, and payout ratio reached 24.96%. The year before the numbers were 0.32% and 27.32% correspondingly. See high-dividend stocks and find more opportunities for your portfolio.
As of Jul 27, 2025, the company has 37.53 K employees. See our rating of the largest employees — is HDFC LIFE INS CO LTD on this list?
Like other stocks, HDFCLIFE shares are traded on stock exchanges, e.g. Nasdaq, Nyse, Euronext, and the easiest way to buy them is through an online stock broker. To do this, you need to open an account and follow a broker's procedures, then start trading. You can trade HDFC LIFE INS CO LTD stock right from TradingView charts — choose your broker and connect to your account.
Investing in stocks requires a comprehensive research: you should carefully study all the available data, e.g. company's financials, related news, and its technical analysis. So HDFC LIFE INS CO LTD technincal analysis shows the neutral today, and its 1 week rating is buy. Since market conditions are prone to changes, it's worth looking a bit further into the future — according to the 1 month rating HDFC LIFE INS CO LTD stock shows the buy signal. See more of HDFC LIFE INS CO LTD technicals for a more comprehensive analysis.
If you're still not sure, try looking for inspiration in our curated watchlists.
If you're still not sure, try looking for inspiration in our curated watchlists.