HDFCLIFE TOWARDS 800-840 levels
HDFCLIFE Ltd is trading in an up-sloping channel, and within this channel, there is a probability of a Shark Pattern, which if unfolds can take stock towards 800- 840 levels in the coming weeks and months.
Can't comment on how smooth is movement is going to be, but any dip in the stock would be an opportunity to go long in the stock, as long as the stock is trading above the 590-600 levels.
Positional Trade timeline: 3-4 months.
The upside of approx 25%, more if bought in the dip.
HDFCLIFE trade ideas

HUL 30 MINT CHART PATTERN HUL chart show me some negative move simitrical chart pattern and if price break 2645 then HUL can do some down move in intraday but it does not first break 2670 . bear active when HUL trade below 2647 and it can come near 2622 that is 1st target and SL - 2665 . SL MUST FOLLOW

BREAKOUT IN HDFCLIFEThe stock has finally managed to move and sustain above 600 levels, which it was struggling to cross for the past many months.
Weekly closing above 620 levels would suggest further upside in the stock up to 750 and 850 levels in the coming months.
Any dip in the stock would be an opportunity in the stock to go long or add further to your long positions.
Immediate support zone 626- 590
Positional Targets:- 750 and 850

Bullish on DivisLabGap covered on Weekly. higher Low formation. Indicates a reversal with better Buy Volumes

#HDFCLIFE... looking good 23.05.23#HDFCLIFE.. ✅▶️
Intraday as well as swing trade
All levels given in charts ...
IF good potential seen then we work in options also
if activate then possible a huge movement Keep eye on this ...
We take trade only when it activates...
Possible to give good target
TRADING FACTS

HDFCLIFE--Bullish or Bearish ??------>> the stock is trending upwards.
-------->> now the price is at resistance facing some difficulty to move upwards,
---------->>broken the trendline and trading in a range, waiting for retest of supply and continue to fall down or take the help of demand zone and will again move upwards.
----------->> track this stock price from demand to go upside or breaks below sell on retracement to bottom demands.
we have demand @ 520 range.
supply @ 590 range.
keep track this instrument.

HDFC LIFE 1HR (10/05/2023)NSE:HDFCLIFE
Hello traders ,
All important levels are drawn in the chart.Work with risk reward ratio. not taking a trade is also a trade.
A trade cant change anything keep in your mind,if you think one trade can change your life then you are doing gambling in the market.take calculated risk.
major resistance in hdfc life is 595
and major support is 516.

HDFC LIFE INSURANCES Buy price - 353.40
Target price - 600.60
Stop loss - 518.20
Go long , 50 EMA cross 100 EMA from below , make Cup and handle pattern .

HDFCLIFE getting ready for a strong moveHdfclife has been consolidating in an upsloping range for the past one month.
Today's price action suggests it is picking up momentum and getting ready for a strong move up to the 590-600 levels.

HDFC Life Insurance easy 15% gainsNSE:HDFCLIFE
Gains: 15%
Duration: 80-90 days
*Not a financial advice.
My charts speaks louder than words.
I'm a chartist and I paint charts.

HDFCLIFE short positionThe price is respecting upsloping support. However it is approaching horizontal resistance.
Our strategy is to enter short position once the price breaks the upsloping support and back tests it and confirms it as a resistance.
The target: 458.20$
In validation of this thesis would be if the price comes back above the upsloping support


HDFCLIFEConfluence:
=Inside candle
=Imbalance market space
Short @ 529
Stop loss @ 0.50%
Target @ 1%
Disclaimer
ONLY FOR EDUCATIONAL PURPOSE.

Monthly divergence in hdfclifeAs you see in chart there was monthly divergence price can retest candle then go ahed

HDFC Life Stock Analysis HDFC life stock make a decending Triangle pattern in uptrend (major trend down).
You can add this stock in your swing stock watchlist.
if stock breakout the pattern then for long if breakdown the lvel then for short
Always do your own analysis first.......

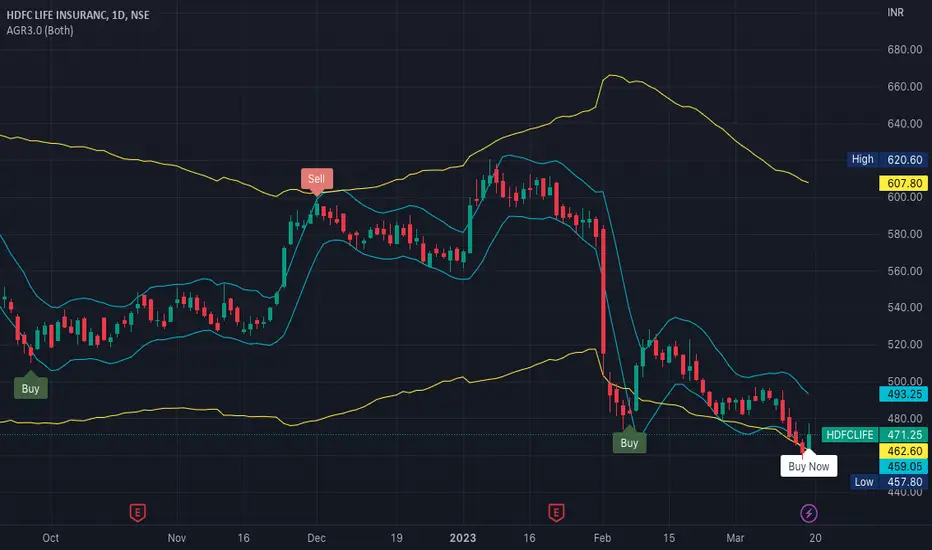
hdfclifeHdfclife Dt-22-03-2023
trandline breakout CMO 497.45
keep eye 505+ closing
upside candidate for 525/530

HDFCLIFE - Weekly AnalysisIn the Weekly Chart of HDFCLIFE ,
we can see that, it showed a false breakout at 590 level and we saw a drastic fall.
Also it did not hold at 200 EMA.
Currently it is taking support at trendline.
If you want to enter in HDFCLIFE , Let it form a Bullish Candle or Bullish pattern.

HDFC Life Retest doneHDFC life on successful retest holding above 510-515 rage can make it back to the regression channel and continue the previous trend.

HDFC Life go for LongDB in Monthly time frame , channel formation in Monthly time frame
Sideways in weekly market and its in bottom , target is 750

HDFCLIFE view for tomorrowHDFCLIFE LEVEL FOR TOMORROW....
Follow strict risk reward and stop loss...
Consider charts for educational purposes..


HDFCLIFEHdfclife broke out of falling channel on 30 min TF with decent volumes.
Could be bought with mentioned stoploss & targets,.
