considering the consolidation after break outmany people known the consolidation before breakout is good but fail to consider the consolidation (sideways move) after the breakout. it also gives a massive move. in this chart consider entering on the breakout of horizantle line (price closing above 206) .target is 265.
happy trading!
HEMIPROP trade ideas

Hemisphere turning Double Sphere :)Hemisphere Properties from the Realty Sector is in limelight recently. An interesting Technical pattern is in the making
1. Around 160 levels, the price has formed a Double Bottom pattern on Daily Timeframe and broke out of its neckline as well confirming the pattern
2. Also from 235 down to 160, there is an interesting "Double" Inverted Head and Shoulders pattern formed. The earlier Inv H&S pattern could not breakout, but this time, the price decisively broke out of the neckline above 220 levels and today it is blasting over 4.5%
Just the name is "Semi", but all Pattern are "Double" to get you blasting returns :)
If the price is able to sustain above 233 by end of day (July 15), then targets are 265, 325
Disclaimer:
3+ Years Teaching Experience in Stock Market - Technical Analysis, Behaviour Analysis, Advanced Patterns, Emotional Management, News based Trading...
We are NOT SEBI Registered and Our focus is NOT providing Buy/Sell Recommendations/calls. Primary Objective is to provide detailed analysis of how to review a chart, explain multi-timeframe views purely for Educational Purposes.
We strongly suggest our followers to "Learn to Ride the Tide irrespective of its Side"
*** Important *** Consult your Financial Advisors before taking any positions
If you like our detailed analysis, please do rate us with your Likes, Boost and share your comments
-Team Stocks-n-Trends

HEMISPHERE AT Opportunity to buyHEMISPHERE now seems at right opportunity to buy as per indicated plan
This is for analysis purpose only.
Trade as per your own risk.

lapu star breakoutA cup and handle price pattern on a security's price chart is a technical indicator that resembles a cup with a handle, where the cup is in the shape of a "u" and the handle has a slight downward drift.
The cup and handle is considered a bullish signal, with the right-hand side of the pattern typically experiencing lower trading volume. The pattern's formation may be as short as seven weeks or as long as 65 weeks.

HEMISHPERE PROP weekly chartvolume growth
support 120
expected level 165
moving averages now turn upside

HEMISPHERE Prop abv 138need a break above 138 for next run , decent land bank in kitty , can it move ?

HEMIPROP - Long Setup, MOVE is ON....Stock name = Hemisphere Properties India Limited.
✅#HEMIPROP trading above Resistance of 201
✅Next Resistance is at 245
✅Moved 34% in 28 DAYS
Daily chart setup
Chart is self explanatory. Levels of breakout, possible up-moves (where stock may find resistances) and support (close below which, setup will be invalidated) are clearly defined.
Disclaimer: This is for demonstration and educational purpose only. this is not buying and selling recommendations. I am not SEBI registered. please consult your financial advisor before taking any trade.

hemisphere properties 1w time frame buy @ 118.70 TARGET 135,hemisphere properties 1w time frame
buy @ 118.70 TARGET 135, 139, 143, 145
decending channel breakout
risk reward 1.5
its just a view trade @ your own risk
sl@ 101.75

💥Hemisphere Properties💥-Nice Breakout💥Hemisphere Properties💥-Nice Breakout
Capital to be deployed- 20k
Investing Price-150-152
Breakout Price-148
Stoploss-121
Targets-194-293
RT for max reach
#hemisphere #stockstowatch #StocksToBuy #StocksInFocus #stocks #StockMarket

HemipropStock name = Hemisphere Properties India Limited.
Daily chart setup
Chart is self explanatory. Levels of breakout, possible up-moves (where stock may find resistances) and support (close below which, setup will be invalidated) are clearly defined.
Disclaimer: This is for demonstration and educational purpose only. this is not buying and selling recommendations. I am not SEBI registered. please consult your financial advisor before taking any trade.

Hemisphere Prop Ind Ltd: can we expect 121 this year?Looks like Hemisphere Prop Ind Ltd will try to test 121 this year, lets see


HEMIPROPThe stock is likely to give a good breakout if it manages to break the range and the level of 167.35 . Do your own research before taking a trade. Thank you.

Hemisphere Properties India LtdHemisphere Properties India Ltd is almost ready to go for the new top, i f it will cross the BD trendline without a red candle.
Minimum target 188
1st target 275

And the name is HEMISPHERE HEMISPHERE has aroused after a very long time ,overcame resistance of 145 ,taking continuous support from 138-139 level , retested 140 level and now. moving forward towards new targets , pick now for long , go for it , future seems to be bright ,since Tata son's are 14 percent stack holder in this company
can look for below targets
1st target 160
second target 198
this is my view looking at chart pattern and price actions,advised to use your check points and indicators before trading
Happy trading

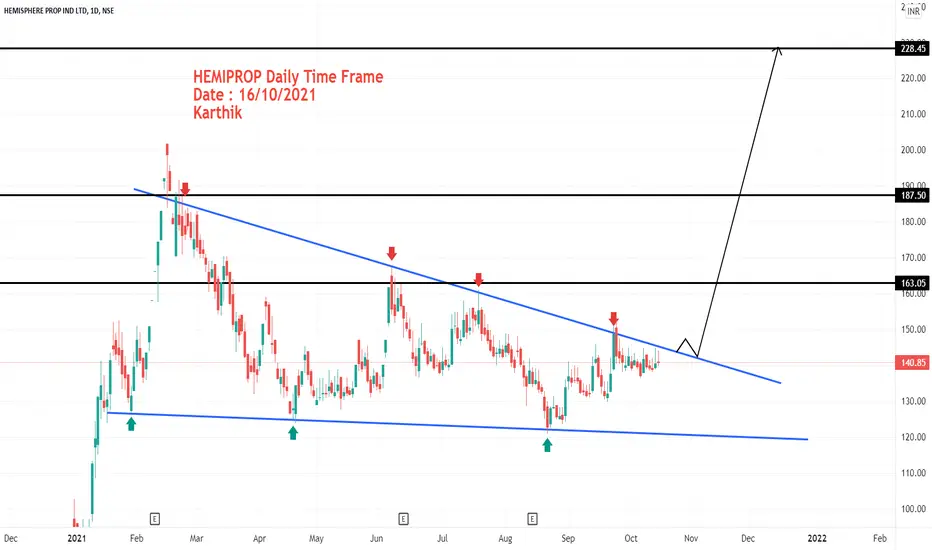
HEMIPROP Daily Time FrameEnter After a Breakout!
Enter After a Breakout! go long once-perfect breakout done!
Hemisphere Properties | Chaiwithanoop | SENSEX | NIFTYHemisphere Properties.
long term , portfolio holding
hemisphere properties
cmp 140. add till 125

#HemiPropFlavour of the town: #RealEstate #triangle breakout
Buying Range: 130-150
SL: 120
Target: 200+
Horizon: 6 months to 1 year

HEMIPROP : 45% upsidefirst post : )
I have learnt a lot from you guys and wanted to give back to the community

Hemisphere breakdownHemisphere breakdown seems on the charts... Target seems to be 80.. Just a study purpose share for chart patterens.


