Strong uptrend Buy CMP 4379
Easy target 🎯 4790
Final target 🎯 5003
Once closing above 5003 🚀 moving all time high
HEROMOTOCO trade ideas


HEROMOTOCORP CMP 3740. (Positional)Super strong largecap corrected almost 45% from last high.Now trading at strong support zone.Add this to your watchlist and Portfolio for long term.Risk Reward is best.See how it perform in coming days.Thank You.


Heromoto - trying to break trendline. BuyStock is trying to break out of the downtrend line after a significant correction
Reasonable valuations and good risk reward on longs here on this name

#HEROMOTOCORP DEMAND ZONE A demand zone at 3395 indicates a potential area of buying pressure, where price may reverse or bounce upward. Traders can consider going long on price rejection at this zone, with a stop loss below 3395.

Hero MotoCorp Limited Investment OpportunityWe can invest from 3800 - 3870 for short term.
Target 1 - 4600 and Target 2 - 5200
Tenure: 4-5 months
I am not SEBI registered so invest at your own risk.

HERO MOTO CORP Bullish from HERE Hero Moto Corp earlier also known as “Hero Honda” is one of India’s first motorcycle manufacturers.
The company started in 1984 as a Technological collaboration with Honda, Japan. Before this collaboration, Hero was selling Cycles under the brand name, Hero Cycles.
In 2011, Honda group sold its 26% stake in the company to the Munjal's (promoters) and ended the JV. Post the termination of JV, the name of the company was changed to Hero MotoCorp.


Hero MotoCorp Stock Dips: Market Reacts to Weak SentimentHero MotoCorp's stock saw a decline in trading today, reflecting weak market sentiment and investor concerns.
The drop comes amid broader market volatility and sector-specific challenges, including fluctuating demand and rising input costs.
Analysts closely watch the stock for further movement as investors assess the company's growth outlook.

HERO MOTO CORP LTD PROJECTION FOR THIS MONTH FEBRURARY 20251. **Hero MotoCorp** is the world's largest manufacturer of motorcycles and scooters, headquartered in India.
2. The company was established in 1984 as Hero Honda and became Hero MotoCorp in 2011 after separating from Honda.
3. It has a strong presence in over 40 countries across Asia, Africa, and South America.
4. Hero MotoCorp is known for popular models like Splendor, Passion, and HF Deluxe.
5. **Dr. Pawan Munjal** is the Chairman and CEO, leading the company’s global expansion and innovation.
6. The company focuses on sustainability, investing in electric vehicles like the Hero Vida V1.
7. It has multiple state-of-the-art manufacturing plants in India and one in Colombia.
8. Hero MotoCorp has a strong R&D facility, the **Centre of Innovation and Technology (CIT)** in Jaipur.
9. The company is actively involved in corporate social responsibility (CSR) through education and skill development initiatives.
10. It continues to innovate with strategic partnerships and investments in future mobility solutions.

HERO MOTO CORP BULLISH VIEW
Hero MotoCorp, an Indian multinational motorcycle and scooter manufacturer, is the world’s largest two-wheeler producer. Founded in 1984, it became Hero MotoCorp in 2011 after splitting from its joint venture with Honda. The company is renowned for its reliable, fuel-efficient bikes, like the Splendor and Passion. With a strong presence in over 40 countries, Hero MotoCorp is committed to sustainable mobility and innovation. They’re actively exploring electric vehicle technology and green initiatives to shape the future of transportation.
How’s that? Anything you’d like to adjust or add?

HERO MOTO CORP PROJECTION & FRAMEWORK OF CHART1. Hero MotoCorp is the world’s largest manufacturer of two-wheelers, headquartered in India.
2. It was founded in 1984 as Hero Honda, a joint venture between Hero Cycles and Honda, before becoming Hero MotoCorp in 2011.
3. The company produces a wide range of motorcycles and scooters, known for their fuel efficiency and affordability.
4. Popular models include the Splendor, Passion, and HF Deluxe, which are widely used across India and other markets.
5. Hero MotoCorp is expanding globally and investing in electric mobility with its EV brand, Vida.

Hero Moto Corp Bullish View 29-1-251. Hero MotoCorp is the world's largest manufacturer of motorcycles and scooters, based in India.
2. It was founded in 1984 as a joint venture between Hero Cycles and Honda, but became independent in 2010.
3. The company is known for iconic two-wheelers like the Splendor, Passion, and Glamour.
4. Hero MotoCorp operates in over 40 countries with multiple manufacturing plants globally.
5. It focuses on innovation and sustainability, with a growing portfolio of electric vehicles.

HEROMOTOCO on supportHeromotoco is on crucial support of previous ATH, will it bounce back, time will tell.
current market condition is not good, be very cautious while taking any trade.
HEROMOTOCO | SHORT | INTRADAYHEROMOTOCO is weak on Intraday basis and on the Daily charts.
Price has been correcting since the start of January which is in continuation with the overall long term Bearish trend since Sep 2024.
Short position can be taken on Intraday basis since the price has clearly rejected the Weekly Pivots.
Target would be 4004 price level.
SL would be 4090 level.
Though this is not a good risk reward trade, those willing to play high risk can possibly take this for a 1:1 kind of trade.

Levels to watch out As of January 2025, the intrinsic value of the stock is estimated to be approximately 4,137.50 per share, based on fundamental analysis and available data. With the current market price hovering around 4,130, the stock is trading just below its intrinsic value, suggesting that it is fairly priced at the moment.
For investors seeking attractive entry points, prices around 3,900 could offer a discount to the intrinsic value, presenting an opportunity to buy at a potentially undervalued level. This price range could be seen as a good long-term investment opportunity, assuming the company continues to perform well and the market remains favorable.
Furthermore, for those with a more conservative approach or seeking a greater margin of safety, prices near 3,300 could represent a deeper undervaluation.

HERO MOTOR- MAJOR CORRECTIONHero Motor Corp- Almost a 3x from March 2023 to Sept 2024. Now under a severe correction, macro and tech factors in play.
Demand zone is 3600-3850, if breaks crucial 4K level.
Sideways in that zone will be good for accumulation for target back 4500+.
Large caps getting attractive in this fall.

at support zoneheromoto at support zone , also rsi in over sold zone can give good bounce back from this levels

HEROMOTOCOPositional / Swing Trade opportunity in HEROMOTOCO
CMP - 4245
SL - 3900
Target 1 - 4915
Target 2 - 6130
DISCLAIMER: Not financial advice. Only for educational purposes.
Invest at your own risk

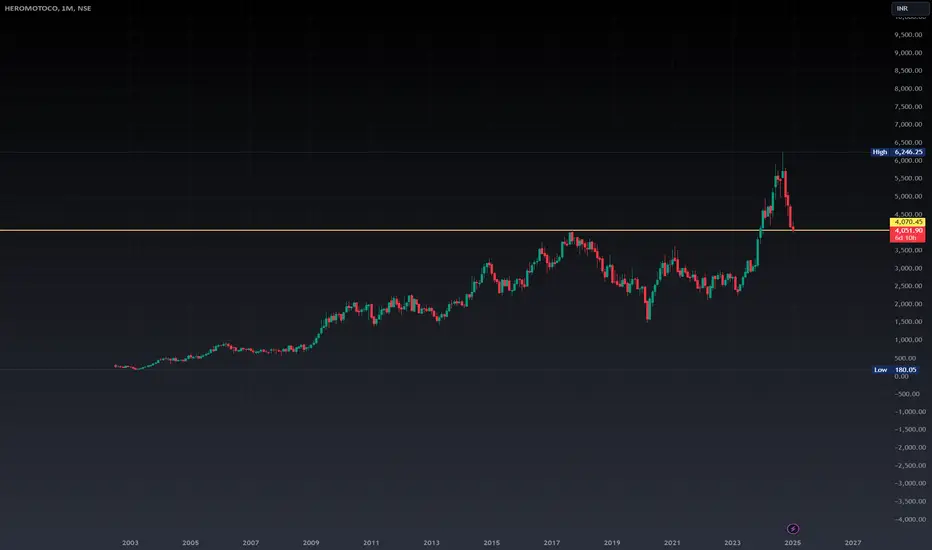
HERO MOTOR- SUPPORT TESTHero Motor broke out of a crucial level at 2900 where multi month resistance was seen. Post that its rise was halted at 6K+ and now its testing a crucial level of support- 0.618 FIB level , break of which can be bad for the stock -mid term. Correction is heavy on this stock, should watch this level carefully over the next 2-3 weeks.

HEROMOTOCO | Long Reversal | BTSTHeromotocorp is reversing from a strong support zone. While the overall trend continues to be bearish, a mean reversion is playing out. Which means a target of 4500 is feasible in the near short term.
An Intraday or BTST type trade can be taken for a quick target to 4500.
SL would be todays low.
