HFCL trade ideas


HFCL Ltd - Strong Bullish Momentum (Buy & Hold)HFCL Technical Analysis:- As per previous chart history and current chart pattern, this is the best time to buy this stock as HFCL appears to be in a bullish trend based on several technical indicators.
Buy HFCL at CMP@129 or wait for a dip to enter in the buy trade.
Nearest Target: 140
Maximum Target: 200+
Here's a breakdown:
Positive Signs of HFCL:
Moving Averages: Both short-term (e.g., 15-day, 50-day) and long-term (e.g., 50-day, 200-day) moving averages are showing an upward trend, indicating bullish momentum.
PRice Action: HFCL recently made a new one-year high, signifying strong buying pressure.
Breakouts: Positive breakouts above resistance levels are observed on charts.
Oscillators: While some oscillators might provide neutral readings, others like MACD hint at a mildly bullish trend.
RSI: The Relative Strength Index (RSI) might be hovering near the overbought territory, suggesting a potential pullback in the short term.
Overall Trend of HFCL:- The technical analysis of HFCL is predominantly bullish. The moving averages, price action, and breakouts all point towards an upward trend. However, a slight caution might be warranted due to the RSI nearing overbought levels.
Here are some additional points to consider:
My Personal Opinions:- Limited data is available, but some sources suggest a target price as high as 140.00.
News and Events: Keep an eye on any relevant news or events that could impact the stock price.
Remember: This analysis is based on publicly available information and should not be considered financial advice. It's crucial to conduct your own research before making any investment decisions as I am not SEBI registered person
Thanks for your support as always

HFCL Big Base Breakout - Target 160 << 175 << 200Big Base Perfect Cup and Handle Chart with good volumes - Retest also done

Did you buy HFCL?As published in the previous post,
HFCL did retest and is now trading at 12% higher than reco.
A safe zone to buy was 113 - 114.
I personally bought at 110.
TARGETS?
If you are a short term trader, looking for quick profit, consider closing partial quantity at CMP and rest at 127.
If you think you can hold it and you are fine with your capital invested here, your target is 140, 160, 220.
I will be holding, will buy on dips if it comes.
Happy Trading:)

Hfcl ltdPrior trend up HH HL
retracement till 50% Fibonacci levels
Hidden bullish rsi divergence
Avwap squeeze
Crossed 10 ema with volumes

A good time to accumulate HFCL?• HFCL is trading at around it's all time high.
• The fundamentals are quite good.
• A breakout on February failed and the prices fell and since February it was trading in a range.
• Finally on 12th June it broke out with promising volumes and now has come down to retest it's breakout level which is between 108.80 - 111.50.
• One can observe the markets tomorrow and plan their entry. Although an entry around 113.50 - 114 should be more convincing.
• Buy and hold it. If the prices fall down, if you can't handle the risk, exit and buy on dip at lower level.
• On dips, first buying zone is around 90. The second is around 84-82.
• Invest doing your own analysis. Thanks

HFCL - Go long above 120www.tradingview.com
Entry above 120, will add on dip till 100
Target 130 , 135
SL close below 80
Holding period 5 days, close the trade if given 4% profit of deployed capital
Standard Disclaimer :- This is not a Buy or Sell recommendation. I am not SEBI Registered. Please consult your financial advisor before making any investments . This is for Educational purpose only.

Expected 65% return in HFCL and make a new ATHHFCL seems strong closing in weekly
breakout in weekly triangle rally may continue further upto 65% and make a new all time high
Volume also in increasing in past weeks
Keep a look into this.
Note*- The views expressed are based on personal observations/opinions. Please do you own research before making any trading decisions.

HFCL will give 50% returns ? cmp 100.40HFCL cmp 100.40
Holding above 113.40 would lead upto 128.90 - 133.30, Breaking these levels will lead further move.
Accumulation zone 93.20 - 97.50
Support placed at 81.25 - 83.70


HFCL BRAKEOUT ON DAILY CHARTNSE:HFCL
HFCL gives brake out on daily chart.
good time to enter in this stock
Buy Rate 104
SL 95
Target 122

HFCL Ltd.*HFCL Ltd_Z*
Rising F&F Formation on Yearly Basis.
Strong Price BreakOut & Sustained
Strong Vol Consolidation & Continued Traction.
RSI: 1H>D>W<M. All in Bullish Zone.
EMSA: Widening Gaps amongst 20/ 50/ 100/ 200 levels.
*Trail SL with Upside*
*Book Profit as per Risk Appetite*
*Do Your Own Research as well. This is an Opinion.*
*_Happy Investing_*🤓

HFCL- Setting up very nicely#HFCL setup is turning out to be bullish
Forming a good base. One good green day, will surely trigger new ATH

HFCL STOCK FOR SWING TRADING#HFCL
STOCK FOR SWING TRADING
Entry Price - 101 or CMP
SL - 95
Targets - 118, 135
@Jagadheesh_JP

HFCL @5kBreakout of multiyear resistance
Very big clean range on Left
Qty 55 @ 92.50
Bought yesterday
Target & Stoploss not defined
Expecting very big move

Symmetrical triangle.year 2003 TO Year 2021 Price consolidated in same range, and get the Price breakout on ATH, since 2021 to 2024 made symmetrical triangle and breakout,

Double Digit Stock - HFCL📊 Script: HFCL
📊 Sector: Infrastructure Developers & Operators
📊 Industry: Engineering - Turnkey Services
Key highlights: 💡⚡
📈 Script is trading near middle band of BB.
📈 MACD is giving crossover .
📈 Already Crossover in Double Moving Averages.
📈 Right now RSI is around 53.
📈 One can go for Swing Trade.
⏱️ C.M.P 📑💰- 99
🟢 Target 🎯🏆 - 109
⚠️ Stoploss ☠️🚫 - 94
⚠️ Important: Always maintain your Risk & Reward Ratio.
✅Like and follow to never miss a new idea!✅
Disclaimer: I am not SEBI Registered Advisor. My posts are purely for training and educational purposes.
Eat🍜 Sleep😴 TradingView📈 Repeat 🔁
Happy learning with trading. Cheers!🥂

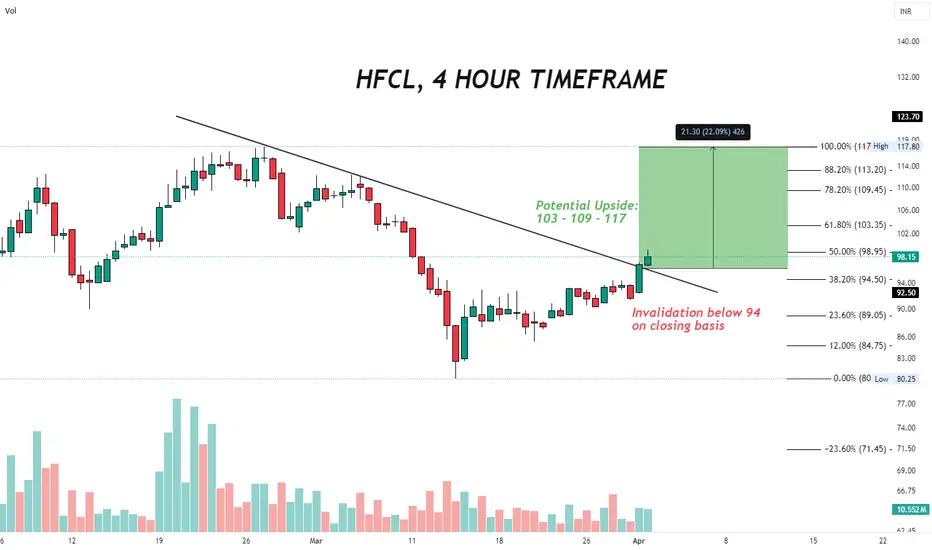
HFCL Breakout done!Looking to further ascend after the breakout of the downtrend.
Targets and invalidation is mentioned inside the chart itself, Please refer.
HFCL BREAKOUTHFCL Breakout with Massive Volume .
Expected Minimum gain 20 % for Short term
Follow proper Money Management
Disclaimer : This is not a Buy or Sell recommendation. Please consult your financial advisor before making any investments . This is for Educational purpose only.

HFCLClean breakout was spotted. Entry cannot be recommended at current level as stoploss is too wide now. One can wait for some pullback/ restest or can look for opportunities at lower timeframes in weekly or daily. Market is at all-time highs, stay alert and always keep an eye on overbought RSI levels for timely exit.
Disclaimer: Intended for educational purpose only and it's not a buy or sell recommendation.

Symmetrical Triangle Breakout 3 Years rangeyear 2002 TO 2021 made range in channel pattern in and made breakout given the rally 840%.
in 2 years constant. from 2021 to 2023 made symmetrical triangle and given the break out, we we looing last rally as future target. with 25% SL from now.
Dear Folks,
If you love my idea's you can cheers with coin to me.

HFCL A good pickGood stock for long term.
Fundamentals are strong.
Good time to buy.
This is just my point of view.
Research on your own and invest 🤝
I am not sebi registered
